. 2025 Jul;57(7):1611-1619.
doi: 10.1038/s41588-025-02224-z. Epub 2025 Jul 9.

Decomposition of phenotypic heterogeneity in autism reveals underlying genetic programs

Affiliations

Decomposition of phenotypic heterogeneity in autism reveals underlying genetic programs

Aviya Litman et al. Nat Genet. 2025 Jul.

Abstract

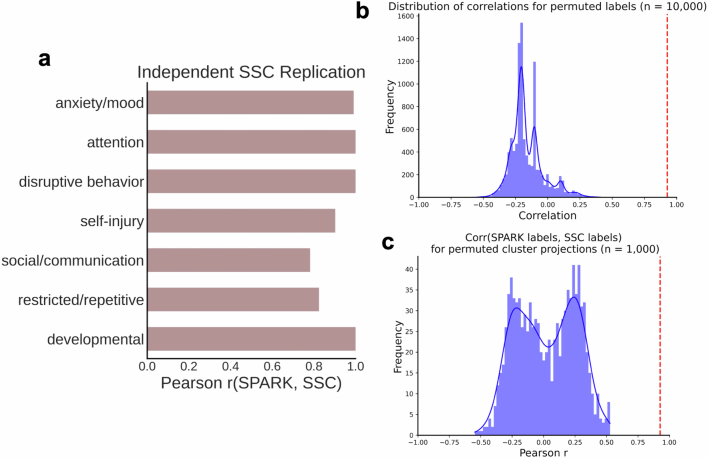
Unraveling the phenotypic and genetic complexity of autism is extremely challenging yet critical for understanding the biology, inheritance, trajectory and clinical manifestations of the many forms of the condition. Using a generative mixture modeling approach, we leverage broad phenotypic data from a large cohort with matched genetics to identify robust, clinically relevant classes of autism and their patterns of core, associated and co-occurring traits, which we further validate and replicate in an independent cohort. We demonstrate that phenotypic and clinical outcomes correspond to genetic and molecular programs of common, de novo and inherited variation and further characterize distinct pathways disrupted by the sets of mutations in each class. Remarkably, we discover that class-specific differences in the developmental timing of affected genes align with clinical outcome differences. These analyses demonstrate the phenotypic complexity of children with autism, identify genetic programs underlying their heterogeneity, and suggest specific biological dysregulation patterns and mechanistic hypotheses.


Conflict of interest statement

Competing interests: The authors declare no competing interests.

Figures

Fig. 1
Fig. 1. Overview of study design and description of identified subclasses.
a, Study design for parsing the phenotypic heterogeneity of autism and deciphering the genetic factors contributing to individual presentations. A GFMM was trained on a matrix of probands (n = 5,392 individuals) by phenotype (239 features describing item-level and composite phenotypic measure data). We describe four data-driven classes of autism that exhibit differing phenotypic presentations and trait patterns. These four subclasses were further characterized by external validations and genetic analyses. b, To demonstrate differences in phenotypic patterns, we assessed the propensity of each class toward seven phenotype categories. Values close to 1 indicate that the majority of phenotypes within the category were significantly and positively enriched for the phenotype domain compared to probands in other classes (indicating higher difficulties), and values close to −1 indicate significant negative enrichment or depletion for a given phenotype domain compared to probands in other classes (indicating lower difficulties). Sample sizes for all analyses shown were as follows: Broadly affected, n = 554 (magenta); Social/behavioral, n = 1,976 (green); Mixed ASD with DD, n = 1,002 (blue); Moderate challenges, n = 1,860 (orange); unaffected siblings, n = 1,972. c, Distributions of two key developmental milestones: the age when the individual first walked and the age when they first used words (both in months) across the four classes, with nonautistic siblings as a control (n = 1,972). d, Individual total scores from the SCQ by class, with nonautistic siblings as a control (n = 1,972). Center lines in all box plots represent the median, box limits represent the 25th and 75th percentiles, whiskers extend to show 1.5× the interquartile range, and outliers are shown separately as open circles. One-sided independent t-tests with adjustment for multiple comparisons (Benjamini–Hochberg correction) were used to determine the significance of enrichment for each class compared to siblings, as well as for all possible class–class comparisons (*FDR < 0.1, **FDR < 0.05, ***FDR < 0.01; NS, not significant). Stars directly above the box plot indicate comparisons to siblings, whereas stars accompanied by horizontal bars indicate class–class comparisons. Schematic in a created with BioRender.com.
Fig. 2
Fig. 2. Clinical validation and replication of subclass characteristics.
a, Clinical validation of classes with external medical diagnoses. We computed the FE (x axis) and statistical significance (FDR) for a selection of available diagnoses for each class. Open circles indicate FDR > 0.05, whereas closed circles indicate FDR < 0.05. Statistical comparisons were computed against siblings as background using one-sided binomial tests and adjusted for multiple comparisons (Benjamini–Hochberg correction). The dotted line indicates FE = 1. Sample sizes for all analyses shown were as follows: Broadly affected, n = 554 (magenta); Social/behavioral, n = 1,970 (green); Mixed ASD with DD, n = 1,001 (blue); Moderate challenges, n = 1,856 (orange); unaffected siblings (n = 1,599). b, External validation of classes with additional parent-reported data from background history and medical history questionnaires. Displayed are: language level at enrollment, parent report with four levels reflecting language abilities (0, nonverbal; 1, single words; 2, phrases; 3, sentences), total number of interventions for probands (including options such as medication, social skills groups, speech therapy and counseling), cognitive impairment at enrollment, a binary indicator of a diagnosis of intellectual disability or cognitive impairment, and age at diagnosis in months. Box plots (center lines represent the median, box limits represent the 25th and 75th percentiles, whiskers represent 1.5× the interquartile range, open circles represent outliers) were plotted for continuous variables (one-sided independent t-tests), whereas bar plots displaying means and 95% confidence intervals were plotted for binary variables (one-sided binomial tests) and categorical variables (one-sided independent t-tests; distributions shown in Extended Data Fig. 5d). *FDR < 0.1, **FDR < 0.05, ***FDR < 0.01. c, Replication of phenotype classes in the SSC. An independent model was trained on the SPARK dataset (n = 6,393) for features matching across the two cohorts and applied to the SSC dataset for all individuals with complete data across features (n = 861). Bars display Pearson correlation coefficients (x axis) between SPARK and SSC category enrichment proportions across four classes.
Fig. 3
Fig. 3. Genetic analyses of genome-wide common and rare variant signals.
a, PGS for ASD GWAS and related phenotypes and conditions. PGS were normalized by the mean of sibling scores within each condition. Sample sizes were as follows: Moderate challenges, n = 822; Broadly affected, n = 225, Social/behavioral, n = 425; Mixed ASD with DD, n = 822; unaffected siblings, n = 476. b, Count per offspring of high-impact DNVs (left) and high-impact rare inherited variants (right) across all protein-coding genes. High-impact variants were defined as variants predicted to be either high-confidence LoF or likely pathogenic missense. Sample sizes for b and c were as follows: Moderate challenges, n = 809; Broadly affected, n = 145; Social/behavioral, n = 640; Mixed ASD with DD, n = 419; unaffected siblings, n = 1,013. c, Analysis of evolutionarily constrained genes across autism classes and nonautistic siblings. Using the gene-centric measure of evolutionary constraint, pLI, we assigned genes with pLI ≥ 0.5 to one of two categories: pLI ≥ 0.995 (higher constraint genes) or 0.5 ≤ pLI < 0.995 (lower constraint genes). Count burdens (dnLoF) per offspring were then computed for each class. In all parts, circles indicate the mean and error bars show the 95% confidence intervals. Statistical significance was computed with one-sided independent t-tests and adjusted for multiple comparisons using Benjamini–Hochberg correction.*FDR < 0.1, **FDR < 0.05, ***FDR < 0.01. Stars above the 95% confidence intervals indicate comparisons to siblings, whereas stars accompanied by horizontal bars indicate direct class comparisons. All statistically significant comparisons are shown.
Fig. 4
Fig. 4. Functional gene set analyses reveal differing genetic profiles.
a, Enrichment and significance of dnLoF burden in each class and gene set. We retrieved seven relevant gene sets and computed the aggregated dnLoF burden for each individual in every gene set. FE (bubble size) and FDR significance (open versus closed circles) were computed relative to nonautistic siblings using one-sided independent t-tests followed by adjustment for multiple comparisons (Benjamini–Hochberg correction). An FDR cutoff of 0.05 was used to determine significance. b, ORs (y axis) across classes for dnLoF variation in ASD risk genes (left) and FMRP target genes (right). ORs for de novo synonymous (dnSyn) variation are displayed for ASD risk genes. Statistical significance was computed with Fisher’s exact tests comparing each class to nonautistic siblings and adjusted for multiple comparisons using Benjamini–Hochberg correction. For ASD risk genes, FDR: 0.09, 0.002, 0.009, 0.001 for dnLoF; FDR: 0.85, 0.85, 0.85, 1.0 for dnSyn; for FMRP genes, FDR: 0.004, 0.0004, 0.0005, 0.002 for dnLoF. *FDR < 0.1, **FDR < 0.05; ***FDR < 0.01. c, Top significantly affected gene ontology (GO) biological processes and molecular functions are reported for each class against a genome-wide background of protein-coding genes. Gene sets for GO enrichment analyses include all protein-coding genes affected by high-confidence dnLoF or pathogenic missense variation present in individuals from each class. The plots display FE (x axis) and log-transformed FDR (bubble size, hypergeometric test with multiple hypothesis correction). Terms were selected by FDR and sorted by FE. For the Moderate challenges, Social/behavioral and Mixed ASD with DD classes, an FDR cutoff of 0.05 was used, whereas a cutoff of 0.1 was used for the Broadly affected class. Shaded boxes represent GO biological processes, and unshaded boxes represent GO molecular functions. Sample sizes in all analyses shown were as follows: Moderate challenges, n = 809; Broadly affected, n = 145; Social/behavioral, n = 640; Mixed ASD with DD, n = 419; siblings, n = 1,013.
Fig. 5
Fig. 5. Cell-type-specific and developmental-stage-specific analysis of variant impacts.
a, Trends from Herring et al. representing the gene expression trajectories of brain development genes differentially expressed across developmental stages. Gene expression trajectories follow one of four general patterns: ‘up’ (first), ‘trans up’ (second), ‘trans down’ (third), ‘down’ (fourth). Trends are measured across the six stages of development (x axis): fetal, neonatal, infancy, childhood, adolescence and adulthood. b, Patterns of dnLoF variant enrichment across classes (x axis), major cell types of the prefrontal cortex (y axis) and gene expression trends (y axis). For each class, we computed the FE (bubble size) and corrected P values (FDR, one-sided independent t-tests adjusted for multiple comparisons using Benjamini–Hochberg correction) of variant burden compared to that of nonautistic siblings. Open circles indicate FDR > 0.05 (not significant), and closed circles indicate significant enrichment (FDR ≤ 0.05). Each column is colored by the corresponding phenotypic class color, with purple representing the combined pool of all probands (n = 2,013). Sample sizes in the analysis were as follows: Moderate challenges, n = 809; Broadly affected, n = 145; Social/behavioral, n = 640; Mixed ASD with DD, n = 419; siblings n = 1,013. Statistics for all class–class comparisons for this analysis can be found in Supplementary Table 11. Cell type and trend combinations with no significant enrichment in any class are not shown. MGE, medial ganglionic eminence; CGE, caudal ganglionic eminence.
Extended Data Fig. 1
Extended Data Fig. 1. Exploratory class enumeration analyses suggest four components for the SPARK generative mixture model.
A crucial step in mixture modeling is tuning the number of model components through evaluation of fit metrics. Models were trained with varying numbers of components (x-axis) on the phenotype data of n = 5,392 probands over 50–200 iterations with randomly generated seeds. Points represent means and error bars represent the standard deviation for a variety of statistical indicators (y-axis): Validation Log Likelihood (LL), Akaike Information Criterion (AIC), Bayesian Information Criterion (BIC), Sample-Size-Adjusted BIC (SABIC), Consistent AIC (CAIC), and the Likelihood Ratio Test (LRT). The evaluation of these indicators combined with interpretation of each candidate model and class resulted in the selection of a four-component model (shown as vertical dotted line in all plots).
Extended Data Fig. 2
Extended Data Fig. 2. Model characteristics for 3-, 5-, and 6-class models.
In addition to a wide range of statistics, we also considered interpretability in selecting the four-class model. Top plots represent proportion and direction of affinity of each class (y-axis) towards each of seven phenotype categories (x-axis). Bottom plots show SCQ total score and developmental milestone scores (y-axis) for proband classes (n = 5,392 total) and unaffected siblings (n = 1,972). Though the three-class model (n = 1,868, 1,068, and 2,456) also shows separation between classes, there remains a lot of within-class variation, suggesting that additional classes would better capture the heterogeneity of the cohort. The five-class model (n = 781, 1,828, 949, 462, and 1,372) is challenging to interpret, with mixed enrichment patterns and overlap between classes. The six class solution (n = 929, 1,356, 1,263, 390, 690, and 764) is even less interpretable, likely overfitting to our cohort and splitting classes with substantial similarities. All models were trained on phenotype data from n = 5,392 probands in the sample. Center lines in all boxplots represent the median, box limits represent the 25th and 75th percentiles, whiskers extend to show 1.5× interquartile range, and outliers are shown separately as open circles. One-sided independent t-tests with adjustment for multiple comparisons (Benjamini-Hochberg correction) were used to determine significance of enrichment for each class compared to siblings (* indicates FDR < 0.1, ** indicates FDR < 0.05, and *** indicates FDR < 0.01 in all figures). Stars directly above the boxplot indicate comparisons to siblings.
Extended Data Fig. 3
Extended Data Fig. 3. Model stability and robustness to subsampling and random initializations.
a, We trained 100 independent models (each with 20 random initializations) with a subsampling rate of 50% of individuals in the sample (n = 2,696). We compared both the individual class assignments and the overall phenotypic correlations between the subsampled models and the full model. We observed very strong stability across the subsampled models, with averages of 88–96% of individuals assigned to the same group as the full model, as shown in the heatmap representing the proportion of individuals assigned to the same group in the subsampled model as the full model. Additionally, the feature concordance among subsamples and across categories of phenotypes remains very stable, as shown in the bar plot quantifying correlations between the feature enrichments of the subsampled model and the full model (x-axis). In all displayed plots, values and bars represent means, error intervals represent the 95% confidence interval, the color bar varies continuously from low proportion (white) to high proportion (magenta), and individual data points are overlaid on the right. b, We trained 2,000 independent models on the full sample (n = 5,392) with random initializations, each time recording the log likelihood (LL) of the model. We ranked the trained models by their LL and retained the top 100 models for further analysis. We observe very strong stability across the top randomly initialized models, with averages of 90–97% of individuals assigned to the same group as the original model reported in the manuscript, as shown in the heatmap representing the proportion of individuals assigned to the same group in the randomly initialized models as the original model. Additionally, the feature concordance among randomly initialized models and across categories of phenotypes remains very stable, as shown in the bar plot quantifying correlations between the feature enrichments of the randomly initialized models and the original model (x-axis).
Extended Data Fig. 4
Extended Data Fig. 4. Comparison of feature variances.
a, Variability of feature enrichment and direction of enrichment computed for the sample (n = 5,392). To demonstrate variability in feature significance within phenotype categories and classes, enrichments and depletions are plotted for each combination of phenotype category and class, with the y-axis representing the proportion and direction of enrichment of features assigned to the phenotype category (x-axis) and computed within the class. Sample sizes for analyses shown are: Broadly affected (magenta, n = 554), Social/behavioral (green, n = 1,976), Mixed ASD with DD (blue, n = 1,002), Moderate challenges (orange, n = 1,860), and unaffected siblings (n = 1,972). b, We computed the normalized variance (x-axis) of each feature across and within classes for n = 5,392 probands. To obtain the distribution of within class variances, we computed the weighted average of the variances across the four classes for each feature. We plotted the distributions of feature variances, demonstrating that variances between classes significantly exceed variances within classes for n = 205 features (P = 9.97 × 10−176; one-sided independent t-test).
Extended Data Fig. 5
Extended Data Fig. 5. Age and sex distribution breakdown by class.
a, Breakdown of proportion of SPARK cohort individuals (total n = 5,392) assigned by the generative mixture model to each latent class. Classes are represented by the corresponding class colors and numbers are rounded to the nearest percent. b, Proportion of males and females (y-axis) for individuals (total n = 5,392) assigned to each latent class. c, Density of age distribution (x-axis) for individuals assigned to each latent class (total n = 5,392). Colors correspond to class colors. d, Stacked bar plots showing distribution of proportions (y-axis) across classes (x-axis) for two variables: language level at enrollment, a parent report with four levels reflecting language abilities (0 = Nonverbal, 1 = Single words, 2 = Phrases, 3 = Sentences), and cognitive impairment at enrollment (binary True/False). Sample sizes are: Broadly affected (magenta, n = 554), Social/behavioral (green, n = 1,976), Mixed ASD with DD (blue, n = 1,002), and Moderate challenges (orange, n = 1,860). One-sided binomial tests (cognitive impairment) and one-sided independent t-tests (language level) were used to test for significance between classes (data not available for unaffected sibling control). P-values were adjusted for multiple comparisons using Benjamini-Hochberg correction. * indicates FDR < 0.1, ** indicates FDR < 0.05, and *** indicates FDR < 0.01 in all figures.
Extended Data Fig. 6
Extended Data Fig. 6. Phenotypic replication of autism classes in the Simons Simplex Collection (SSC).
a, Independent phenotypic replication of classes in the SSC cohort. A model was independently trained on the Simons Simplex Collection (SSC) dataset for 108 matching features and n = 861 probands. The feature enrichment patterns were computed for the seven phenotype categories (y-axis) and Pearson correlation coefficients with the full SPARK model (n = 5,392) are shown (x-axis). b, Permutation analysis of SSC phenotypic replication. Pearson correlation coefficients (x-axis) computed between the feature enrichment patterns of latent classes in SSC and SPARK for 10,000 random permutations of class labels in the SSC. The dashed vertical red line represents the true correlation from applying the model trained on SPARK data to predict labels on individuals in SSC (Pearson’s r = 0.927). No chance correlations exceeded the true correlation. Model was trained on n = 6,393 probands in SPARK and applied to n = 861 probands in the SSC. c, Pearson correlation coefficients (x-axis) computed between the feature enrichment patterns of latent classes in SSC and SPARK for 1,000 permuted cluster projections onto the SSC. All models were trained independently on the shuffled phenotype labels of the SPARK dataset (shuffling was repeated for every model). The permuted phenotype models were projected onto the SSC and correlated with the true SPARK labels. The dashed vertical red line represents the true correlation from applying the model trained on SPARK data to predict labels on individuals in SSC (Pearson’s r = 0.927). No chance correlations exceeded the true correlation. Models were trained on n = 5,392 probands in SPARK and n = 861 probands in the SSC.
Extended Data Fig. 7
Extended Data Fig. 7. Ancestry PCA plot for genotyped cohort.
Top two principal components of the SNP data (x-axis, y-axis) representing genetic ancestry. Points are colored by self-reported race.
Extended Data Fig. 8
Extended Data Fig. 8. Gene set variant burden analyses.
a, dnLoF burden was computed for each class against out-of-class probands in each of seven gene sets (y-axis) using one-sided independent t-tests (adjusted for multiple comparisons using Benjamini-Hochberg correction). Fold enrichment (bubble size), FDR significance (closed vs. open circles at indicated threshold of 0.05), and direction of enrichment (color) are shown. Sample sizes in all analyses shown: Moderate challenges n = 809, Broadly affected n = 145, Social/behavioral n = 640, Mixed ASD with DD n = 419, unaffected siblings n = 1,013. All computed statistics, class comparisons, and comparisons to siblings can be found in Supplementary Table 8. b, Scatter plots displaying fold enrichment (x-axis) versus FDR significance (y-axis) of de novo missense (dnMis) burden, rare inherited LoF (inhLoF) burden, and rare inherited missense (inhMis) burden across classes and seven autism-relevant gene sets (symbol key). We computed the aggregated burdens for each individual across every gene set. P-values and log2 fold change were computed relatively to non-autistic siblings using one-sided independent t-tests. P-values were adjusted for multiple comparisons using Benjamini-Hochberg correction to compute the log-transformed Q-values (y-axis). Empty shapes represent tests that did not pass multiple hypothesis testing with a threshold of 0.05. Each gene set is represented by a different symbol as indicated in the key. c, Odds ratios for various gene sets included in this manuscript. Odds ratios (y-axis) were computed for dnLoF and dnSyn variants in each autism class against non-autistic siblings across autism-relevant gene sets (four shown here, two shown in Fig. 4b).
Extended Data Fig. 9
Extended Data Fig. 9. dnLoF enrichments across PFC celltypes, developmental gene trends, and phenotype classes.
dnLoF variant enrichment was computed across cell types and developmental gene expression trends (y-axis) for each phenotype class (x-axis). Open circles represent lack of significance (FDR > 0.05), whereas closed circles represent FDR ≤ 0.05 (one-sided independent t-tests adjusted for multiple comparisons with Benjamini-Hochberg correction). Lack of circles represents lack of data. Colors correspond to phenotype class colors and bubble size corresponds to fold enrichment. Sample sizes are: all probands (n = 2,013), Moderate challenges n = 809, Broadly affected n = 145, Social/behavioral n = 640, Mixed ASD with DD n = 419, unaffected siblings n = 1,013.

Update of

References

    1. Diagnostic and Statistical Manual of Mental Disorders 5th edn (American Psychiatric Association, 2013).
    1. Lord, C. et al. Autism spectrum disorder. Nat. Rev. Dis. Prim.6, 5 (2020). - PMC - PubMed
    1. Chiarotti, F. & Venerosi, A. Epidemiology of autism spectrum disorders: a review of worldwide prevalence estimates since 2014. Brain Sci.10, 274 (2020). - PMC - PubMed
    1. Simonoff, E. et al. Psychiatric disorders in children with autism spectrum disorders: prevalence, comorbidity, and associated factors in a population-derived sample. J. Am. Acad. Child Adolesc. Psychiatry47, 921–929 (2008). - PubMed
    1. Sanders, S. J. et al. De novo mutations revealed by whole-exome sequencing are strongly associated with autism. Nature485, 237–241 (2012). - PMC - PubMed

LinkOut - more resources