. 2025 Aug;31(8):2703-2711.
doi: 10.1038/s41591-025-03798-1. Epub 2025 Jul 9.

Plasma proteomics links brain and immune system aging with healthspan and longevity

Affiliations

Plasma proteomics links brain and immune system aging with healthspan and longevity

Hamilton Se-Hwee Oh et al. Nat Med. 2025 Aug.

Abstract

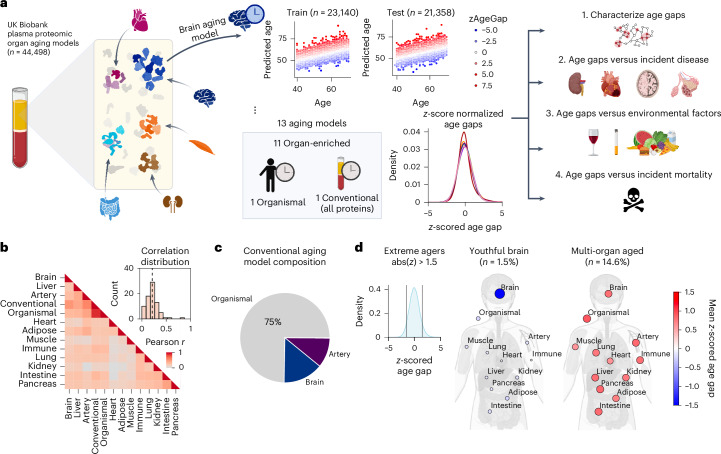
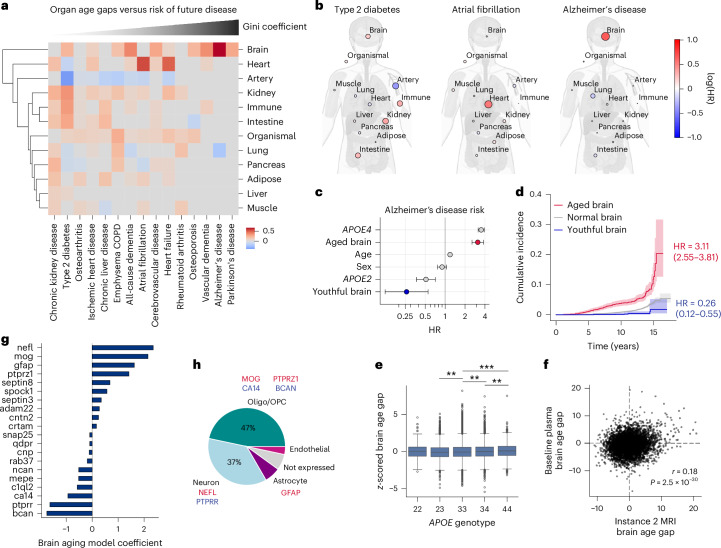
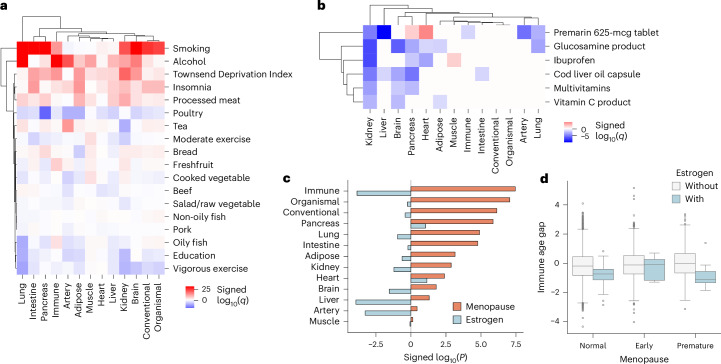
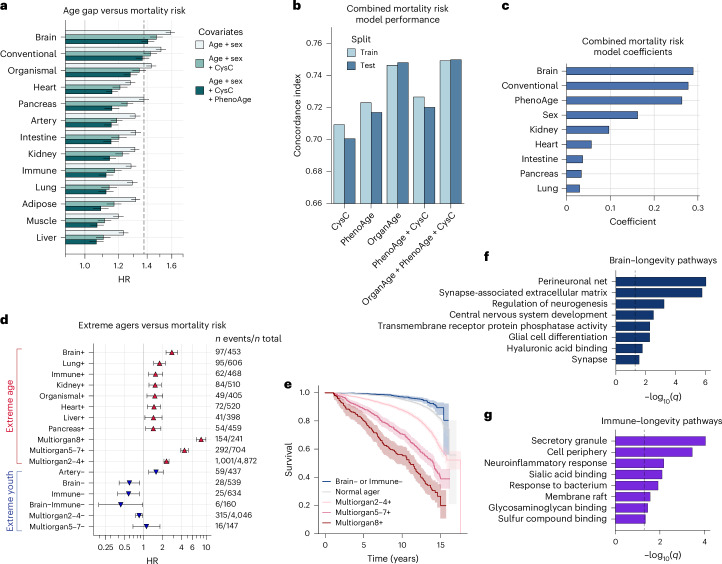
Plasma proteins derived from specific organs can estimate organ age and mortality, but their sensitivity to environmental factors and their robustness in forecasting onset of organ diseases and mortality remain unclear. To address this gap, we estimate the biological age of 11 organs using plasma proteomics data (2,916 proteins) from 44,498 individuals in the UK Biobank. Organ age estimates were sensitive to lifestyle factors and medications and were associated with future onset (within 17 years' follow-up) of a range of diseases, including heart failure, chronic obstructive pulmonary disease, type 2 diabetes and Alzheimer's disease. Notably, having an especially aged brain posed a risk of Alzheimer's disease (hazard ratio (HR) = 3.1) that was similar to carrying one copy of APOE4, the strongest genetic risk factor for sporadic Alzheimer's disease, whereas a youthful brain (HR = 0.26) provided protection that was similar to carrying two copies of APOE2, independent of APOE genotype. Accrual of aged organs progressively increased mortality risk (2-4 aged organs, HR = 2.3; 5-7 aged organs, HR = 4.5; 8+ aged organs, HR = 8.3), whereas youthful brains and immune systems were uniquely associated with longevity (youthful brain, HR = 0.60 for mortality risk; youthful immune system, HR = 0.58; youthful both, HR = 0.44). Altogether, these findings support the use of plasma proteins for monitoring of organ health and point to the brain and immune systems as key targets for longevity interventions.


Conflict of interest statement

Competing interests: T.W-C., H.S.-H.O. and J.R. are co-founders and scientific advisors of Teal Omics, Inc. and have received equity stakes. T.W-C. is co-founder of Vero Biosciences. The remaining authors declare no competing interests.

Figures

Fig. 1
Fig. 1. Plasma protein-derived organ age estimates in the UKB.
a, Study design to estimate organ-specific biological age from plasma proteomics data in the UKB. A protein was called ‘organ-enriched’ if the gene encoding the protein was expressed at least four-fold higher in one organ compared to any other organ in the GTEx organ bulk RNA sequencing atlas. Organ-enriched protein sets were used to train LASSO chronological age predictors. Samples from 11 of 22 centers (n = 23,140) were used for training, and the remaining samples (n = 21,358) were used for testing. An ‘organismal’ model, which was trained on the levels of non-organ-specific (organ-shared) proteins, and a ‘conventional’ model, which was trained on all proteins from the Olink assay, were also developed and assessed. Model age gaps were calculated and then z-score normalized per organ to allow for direct comparisons across organs. Age gaps were characterized and tested for associations with disease risk, modifiable lifestyle choices and mortality risk. b, Pairwise correlation of organ age gaps from all samples. Inset: the distribution of all pairwise correlations, with the dotted line representing the mean. c, A LASSO regression model was used to predict conventional age based on organ ages and organismal age. Organismal, brain and artery ages were sufficient to predict conventional age with r2 = 0.97. Relative weights are shown as a pie chart. d, Extreme agers were defined by a 1.5-s.d. increase or decrease in at least one age gap. The mean organ age gaps of extremely youthful brain agers and accelerated multi-organ agers are shown. Graphics in a and d created with BioRender.com.
Fig. 2
Fig. 2. Organ age estimates predict future age-related disease.
a, Cox proportional hazard regression was used to test the association between age gaps and future disease risk, adjusted for age-at-blood-draw, sex and other age gaps. The heatmap is color coded by age gap log(HR). Heatmap columns are ordered by the Gini coefficient of age gaps per disease. b, Body plots showing logHR values for type 2 diabetes, atrial fibrillation and Alzheimer’s disease from the heatmap in a. c, Cox proportional hazard regression was used to test the association between extreme brain youth/aging and future Alzheimer’s disease risk, adjusted for age-at-blood-draw, sex and APOE4 and APOE2 genotype (n = 37,766). Points show age gap HRs, and error bars show 95% confidence intervals. d, Cumulative incidence curves with 95% confidence intervals showing onset of Alzheimer’s disease over time when comparing individuals with extremely aged brains, individuals with extremely youthful brains and normal brain agers. Age gap HRs and 95% confidence intervals from c are shown. e, Box plot visualization of brain age gap versus APOE genotype (n = 43,326). The box bounds are the Q1, median and Q3; the whiskers show Q1 − 1.5× the interquartile range (IQR) and Q3 + 1.5× the IQR. *P < 0.05, **P < 0.01, ***P < 0.001 from standard two-sided t-test. f, Plasma-based brain age gap at baseline versus MRI-based brain age gap at Instance 2 (several years after baseline visit). Correlation and P value are shown. g, Bar plot displaying the top 20 protein coefficients in the brain aging model. h, Pie chart displaying the proportion of brain aging proteins assigned to each brain cell type based on single-cell RNA sequencing. Cell type was assigned based on cell type with the maximum expression of a given gene. Oligo, oligodendrocytes; OPC, oligodendrocyte precursor cell. Body graphic in b created with BioRender.com.
Fig. 3
Fig. 3. Organ age estimates are sensitive to modifiable lifestyle factors.
a, Linear regression was used to determine the association between age gaps and modifiable lifestyle factors while accounting for all other lifestyle factors as well as age and sex. The heatmap is color coded by signed log10(q). Only significant (q < 0.05) values are indicated by color coding. b, Linear regression was used to determine the association between age gaps and drugs/supplements intake while accounting for age and sex. Only drugs with significant (q < 0.05) youthful associations in at least two organs are shown. Heatmap is color coded by signed log10(q value). Only significant (q < 0.05) values are indicated by color coding. c, Multivariate linear regression was used to determine the association between age gaps versus early menopause and estrogen treatment independent of each other. Bar plot showing signed log10(P value) for menopause and estrogen covariates is shown. d, Box plot visualization of immune age gaps in individuals stratified by menopause status and estrogen treatment (n = 47). The box bounds are the Q1, median and Q3; the whiskers show Q1 − 1.5× the interquartile range (IQR) and Q3 + 1.5× the IQR. Q, quartile.
Fig. 4
Fig. 4. Accrual of aged organs progressively increases mortality risk, whereas brain and immune system youth is associated with longevity.
a, Bar plot showing results from Cox proportional hazard regression analyses, testing the associations between each age gap and future all-cause mortality risk, controlling for labeled covariates (n = 21,775). Bars show HRs, and error bars show 95% confidence intervals. PhenoAge age gap HR adjusted for age and sex (HR = 1.38) is shown as a dashed line for reference. b, Concordance indices from various LASSO-regularized Cox proportional hazard models were trained to predict mortality risk. Performance across train and test centers is shown. Covariates for each model, in addition to age-at-blood-draw and sex, are labeled on the x axis. c, Model coefficients are shown for the combined model (OrganAge + PhenoAge + CysC) from b. d, Forest plot showing results from Cox proportional hazard regression, testing the associations between extreme ager status (‘+’ refers to aged; ‘−’ refers to youthful) and future all-cause mortality risk, controlling for age-at-blood-draw and sex. Only significant (P < 0.05) associations are shown. Points show extreme ager HRs; error bars show 95% confidence intervals; and the number on the right shows the number of events out of the total sample size. e, Kaplan–Meier curves with 95% confidence intervals showing survival over a 17-year follow-up for normal agers, multi-organ agers (with 2–4, 5–7 or 8+ aged organs) and individuals with a youthful brain or immune system (brain– or immune–). f,g, Gene Ontology pathway enrichment analyses from the top 10 brain (f) and immune (g) aging proteins, as determined from the mortality risk FIBA score (Methods). CysC, cystatin C.
Extended Data Fig. 1
Extended Data Fig. 1. Aging model coefficients.
a, For all aging models, the top 20 aging model proteins and their weights are shown.
Extended Data Fig. 2
Extended Data Fig. 2. Organ aging models in the UK Biobank.
a, Predicted organ age versus chronological age. Pearson correlations (r) and mean absolute errors (MAE) shown. b, Correlation between predicted and actual age across all aging models and train/test splits. c, Difference in correlation between predicted and actual age by biological sex. d, Mean difference in organ age gaps between males and females. e, Extreme ager sample sizes and proportions. f, Age distributions per extreme ager group (n = 44,498). The box bounds are the Q1, median and Q3; the whiskers show Q1 − 1.5× the interquartile range (IQR) and Q3 + 1.5× the IQR.
Extended Data Fig. 3
Extended Data Fig. 3. Age gaps across longitudinal visits.
a, Longitudinal proteomics data from a subset of 1,176 individuals were analyzed (880 baseline, 843 Instance 2, and 786 Instance 3 samples). Longitudinal data were available only on the 1.5k-protein Olink assay, so new aging models trained on the 1.5k-assay were developed. New aging models were trained on 44,406 samples without longitudinal data and tested on non-imputed samples with longitudinal data. Only 1.5k-aging models with age estimates that were correlated r > 0.8 with 3k-based age estimates were included for downstream analyses. Correlation between baseline and Instance 2 age gaps are shown. b, Bar plot showing fractions of baseline extreme agers and non-extreme agers that are extreme agers in the same organ in Instance 2. Equivalent plot for youthful agers is shown on the right. c, Age gaps were grouped into bins of 0.5 standard deviation to determine changes in age gap bins across visits. Individual trajectories across visits for extreme immune agers are shown. Equivalent plot for youthful immune agers is shown at the bottom. d, Pie chart showing percent distribution of immune age gap bins in Instance 2 and Instance 3 for individuals who are extreme immune agers at baseline. Equivalent plot for youthful immune agers is shown at the bottom. e, Stacked bar plot showing percent distribution of age gap bins in Instance 2 and Instance 3 for individuals who are extreme agers at baseline. Equivalent plot for youthful agers is shown at the bottom.
Extended Data Fig. 4
Extended Data Fig. 4. Olink versus SomaScan organ aging models.
a, Stanford Olink data contained missing values for the 5 aging model proteins shown. Protein ranks by aging model coefficient compared to total number of proteins in aging model are shown. b, Correlation between predicted versus chronological age in UKB train, UKB test, and Stanford test (cognitively normal controls) data. c, Olink versus SomaScan (Oh and Rutledge et. al. 2023) organ age gaps in Stanford data. Linear regressions with 95% confidence intervals are shown. d, Distribution of correlations between Olink and SomaScan overlapping proteins by name (from Eldjarn et. al. 2023). e, g:Profiler biological pathway enrichment of brain and immune aging model proteins per proteomics platform. f, Brain age gaps versus Alzheimer’s disease diagnosis, per proteomics platform (n = 598). The box bounds are the Q1, median and Q3; the whiskers show Q1 − 1.5× the interquartile range (IQR) and Q3 + 1.5× the IQR.
Extended Data Fig. 5
Extended Data Fig. 5. Age gaps versus disease.
a, Cox proportional hazards regression was used to test the association between age gaps and future disease risk, adjusted for age-at-blood-draw and sex. Heatmap colored by age gap log(hazard ratio) is shown. Heatmap columns are ordered by the Gini-coefficient of age gaps per disease. The most significant associations per disease are highlighted with black borders. The log fold change in hazard ratios between the organ with the most significant age gap versus the conventional age gap is shown below the heatmap. b, Cox proportional hazards regression was used to determine the association between extreme agers and future disease risk, controlling for age and sex and other extreme agers. Heatmap colored by age gap log(hazard ratio) is shown. *p < 0.05, **q (Benjamini-Hochberg correction) <0.05. Non-significant hazard ratios (p < 0.05) were set to zero. c, Linear regression was used to determine the association between baseline organ age gaps and Instance 2 brain MRI volumes, controlling for age-at-blood-draw, age-at-MRI, sex, and estimated total intracranial volume. Non-significant effect sizes (q < 0.05) were set to zero. Red indicates positive associations, while blue indicates negative associations. d, MRI-based brain age versus chronological age in 45,574 individuals from Instance 2 (left). Plasma proteomics-based brain age versus chronological age in 44,498 individuals from baseline (right). Pearson correlations and mean absolute errors are shown. e, Linear regression was used to determine the association between organ age gaps and years since disease diagnosis. Non-significant effects (q < 0.05) were set to zero. f, Visualization of results from e. Organ age gap versus years since diagnosis shown for chronic kidney disease x pancreas age gap and Alzheimer’s disease x brain age gap. Lowess regressions with 95% confidence intervals are shown.
Extended Data Fig. 6
Extended Data Fig. 6. Feature importance for organ aging, Alzheimer’s disease, and mortality.
a, Scatterplot showing results from feature importance for biological aging (FIBA) algorithm to identify proteins in the brain aging model contributing to the brain age gap’s association with Alzheimer’s disease risk. FIBA score (y-axis) indicates Alzheimer’s disease risk effect size loss after permutation of protein values. X-axis indicates absolute protein weight in the brain aging model. Color indicates protein weight in the brain aging model. b, Mean gene expression of brain aging protein-encoding genes in Haney et al. 2024 human brain scRNA-seq data. c-f, Scatterplots showing results from feature importance for biological aging (FIBA) algorithm to identify proteins in the brain (c), conventional (d), artery (e), and immune (f) aging models that contribute to the model age gap’s association with future mortality risk. FIBA score (y-axis) indicates mortality risk effect size loss after permutation of protein values. X-axis indicates absolute protein weight in the aging model. Color indicates protein weight in the aging model. g, Forest plot showing results from Cox proportional hazards regression, testing the associations between extreme ager status and future all-cause mortality risk, controlling for age, sex. Points show extreme ager hazard ratios, error bars show 95% confidence intervals, and number on the right show number of events out of the total sample size. h, Protein levels of youthful brain agers versus normal agers (n = 12,696). The top ten (5 decrease with age, 5 increase with age) proteins based on mortality risk FIBA score are shown. Each protein was linearly adjusted for age, sex, and every other protein in the brain aging model before plotting. Proteins are ordered by the aging model coefficient. The box bounds are the Q1, median and Q3; the whiskers show Q1 − 1.5× the interquartile range (IQR) and Q3 + 1.5× the IQR. i, As in h, but for the immune aging model (n = 12,847).

References

    1. López-Otín, C., Blasco, M. A., Partridge, L., Serrano, M. & Kroemer, G. Hallmarks of aging: an expanding universe. Cell186, 243–278 (2023). - PubMed
    1. Ahadi, S. et al. Personal aging markers and ageotypes revealed by deep longitudinal profiling. Nat. Med.26, 83–90 (2020). - PMC - PubMed
    1. Tian, Y. E. et al. Heterogeneous aging across multiple organ systems and prediction of chronic disease and mortality. Nat. Med.29, 1221–1231 (2023). - PubMed
    1. Oh, H. S.-H. et al. Organ aging signatures in the plasma proteome track health and disease. Nature624, 164–172 (2023). - PMC - PubMed
    1. Sehgal, R. et al. Systems Age: a single blood methylation test to quantify aging heterogeneity across 11 physiological systems. Preprint at bioRxiv10.1101/2023.07.13.548904 (2023).