. 2025 Jul 1;42(7):msaf171.
doi: 10.1093/molbev/msaf171.

Phylogenomics Unveils the Complex Evolution of Retroviruses in Birds

Affiliations

Phylogenomics Unveils the Complex Evolution of Retroviruses in Birds

Qinliu He et al. Mol Biol Evol. .

Abstract

The rise of birds represents one of the major evolutionary transitions in the history of life. Yet, much remains obscure about the origins and diversification of viruses in birds. Endogenous retroviruses (ERVs), relics of past retroviral infections, provide molecular fossils for interrogating the evolution and ecology of retroviruses. Here, we perform phylogenomic mining of ERVs within the genomes of 758 bird species and identify more than 470,000 ERVs, revealing a highly diverse and complex retrovirus repertoire in birds. These ERVs greatly expand the diversity of retroviruses in birds, indicating that exogenous retroviruses characterized in birds to date are highly underestimated. The evolution of retroviruses in birds is shaped by both coevolution and cross-species transmission. Tens of retrovirus lineages originated during the early evolution of birds, four of which contribute to more than 90% of complete ERVs in birds. We also observe recent ERV activity across the bird phylogeny (particularly in Passeriformes). Moreover, we find that ERVs can mediate genome rearrangements, potentially facilitating the genome evolution of birds. Many bird retroviruses recruited genes of cellular provenience, which might drive the evolution of the genome complexity of retroviruses. Together, these results unveil a diverse and complex retrovirosphere in birds and provide insights into the intricate evolution of retrovirus-bird interaction.

Keywords: birds; endogenous retroviruses; phylogenetics; virus evolution.


Figures

Fig. 1.
Fig. 1.
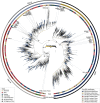
The diversity of ERVs in birds. The phylogenetic relationship of representative ERVs from birds and nonavian vertebrates was reconstructed based on RT protein sequences and rooted with Odin retrotransposons and lokiretroviruses as outgroups. The inner circle indicates the host distribution of ERVs, the middle circle represents the classification of bird ERVs defined in this study, and the outer circle represents the traditional ERV classification. Representative retroviruses were specified, and their abbreviations are provided in supplementary table S4, Supplementary Material online. Bird ERVs are labeled using filled circles. Ultrafast bootstrap values are shown as a gradient and shown near the selected nodes. The full, detailed tree is provided in supplementary fig. S1, Supplementary Material online.
Fig. 2.
Fig. 2.
The distribution of complete ERVs in birds. a) The distribution of complete ERVs in birds at the order level. The bird phylogeny is based on the studies (Avise and Walker 1998; Amaral et al. 2006; Brumfield et al. 2008; Jiang 2019; Pan et al. 2019; Feng et al. 2020; Cuevas-Caballé et al. 2022; Wilcox et al. 2022; Zhao et al. 2023). The number of species and the number of complete ERVs from different major groups are shown. b) The rarefaction curve of ERVs in birds based on RT AAI thresholds of 0.3, 0.5, and 0.7. 95% CIs are shown in shadow. c) The correlation in copy number among four ERV major groups, namely ERV-A/B, E, G, and L1. The number in the box represents the correlation coefficient (Pearson's r). The asterisks indicate significance levels: *** represents P-value < 0.001; ** represents P-value < 0.01; and * represents P-value < 0.05.
Fig. 3.
Fig. 3.
The evolutionary dynamics of ERVs in birds. a) The distribution of LTR–LTR distance of complete ERVs in birds at the level of orders. The bird phylogeny is based on the studies (Avise and Walker 1998; Amaral et al. 2006; Brumfield et al. 2008; Jiang 2019; Pan et al. 2019; Feng et al. 2020; Cuevas-Caballé et al. 2022; Wilcox et al. 2022; Zhao et al. 2023). The gradient represents the proportion of ERVs (0% to 100%) in the corresponding LTR–LTR distance interval for a given bird order. b) The distribution of LTR–LTR distance of ERVs for species pairs from seven bird genera. c) The distribution of LTR–LTR distance of ERVs for eight representative bird orders. The orders are highlighted in a) in colors.
Fig. 4.
Fig. 4.
The evolutionary dynamics of ERVs in Passeriformes. a) The comparison of the number of complete ERVs from Passeriformes, Accipitriformes, Falconiformes, Psittaciformes, and Charadriiformes. Dots indicate the numbers of ERVs in a species. The asterisks *** represents P-value < 0.001. b) The distribution of LTR–LTR distance of ERVs in Passeriformes. c) The distribution of LTR–LTR distance of ERVs from four species, which is indicated in the phylogeny of Passeriformes. The curves fitting of Gaussian mixture models are also shown. The phylogenetic trees of ERVs and the distribution of LTR–LTR distance of specific ERV clades are shown for Prinia subflava (d), Setophaga petechia (e), Eopsaltria australis (f), and Hirundo rustica rustica (g). The phylogenetic tree was reconstructed based on the full-length sequences of ERVs. The ultrafast bootstrap values are shown near the selected nodes. The LTR–LTR distance distribution of specific ERV clades along with the curve fitting of Gaussian mixture models are shown.
Fig. 5.
Fig. 5.
Origins of retroviruses in birds. a) The phylogenetic tree of ERVs from birds and nonavian vertebrates, which is the same as Fig. 1. Groups and classification defined in this study are indicated. G is the abbreviation for Group. The full, detailed tree is provided in supplementary fig. S1, Supplementary Material online. b) Host distribution of different ERVs groups. The minimum time (indicated as the time to the last common ancestors of corresponding bird groups) was shown for specific ERV groups along the bird phylogeny. The minimum time for ERV groups in filled and empty squares was inferred based on orthologous ERV insertions and on virus–host coevolution, respectively. Phylogenetic congruence tests and orthologous ERV insertions are provided in supplementary tables S2 and S3, Supplementary Material online. The pie chart indicates the proportion of complete ERVs from a specific group in all the complete ERVs from birds. The heatmap on the right shows the host range of different ERV groups at the level of bird orders. The gradient indicates the proportion of species with a specific ERV group in a specific bird order. c) The distribution of LTR–LTR distance in certain ERV groups. The colors are the same as those in the pie chart of b).
Fig. 6.
Fig. 6.
Host-related domains in bird ERVs. a) The type and number of host-related domains identified in avian ERVs, with only those having a count >1 displayed. b) The host distribution of CSD (including ribosomal protein S1-like RNA-binding domain (S1_like) [accession no. cl09927]) and 7mt_GPCRs (including 7tmA_OR14-like [accession no. cd15227]). c) Genomic structure and open reading frames (ORFs) of representative avian ERVs with CSD or 7mt_GPCRs domains. d) Genomic structure and ORFs of representative avian ERVs with host-related domains.

References

    1. Amaral FS, Miller MJ, Silveira LF, Bermingham E, Wajntal A. Polyphyly of the hawk genera Leucopternis and Buteogallus (Aves, Accipitridae): multiple habitat shifts during the Neotropical buteonine diversification. BMC Evol Biol. 2006:6(1):10. 10.1186/1471-2148-6-10 - DOI - PMC - PubMed
    1. Anai Y, Ochi H, Watanabe S, Nakagawa S, Kawamura M, Gojobori T, Nishigaki K. Infectious endogenous retroviruses in cats and emergence of recombinant viruses. J Virol. 2012:86(16):8634–8644. 10.1128/JVI.00280-12 - DOI - PMC - PubMed
    1. Avise JC, Walker D. Pleistocene phylogeographic effects on avian populations and the speciation process. Proc Biol Sci. 1998:265(1395):457–463. 10.1098/rspb.1998.0317 - DOI - PMC - PubMed
    1. Blyton MDJ, Young PR, Moore BD, Chappell KJ. Geographic patterns of koala retrovirus genetic diversity, endogenization, and subtype distributions. Proc Natl Acad Sci U S A. 2022:119(33):e2122680119. 10.1073/pnas.2122680119 - DOI - PMC - PubMed
    1. Bolisetty M, Blomberg J, Benachenhou F, Sperber G, Beemon K. Unexpected diversity and expression of avian endogenous retroviruses. mBio. 2012:3(5):e00344-12. 10.1128/mBio.00344-12 - DOI - PMC - PubMed

LinkOut - more resources