

Single-cell transcriptome and multi-omics integration reveal ferroptosis-driven immune microenvironment remodeling in knee osteoarthritis
- PMID: 40636124
- PMCID: PMC12238886
- DOI: 10.3389/fimmu.2025.1608378
Single-cell transcriptome and multi-omics integration reveal ferroptosis-driven immune microenvironment remodeling in knee osteoarthritis
Abstract
Background: Knee osteoarthritis (KOA) is a chronic inflammatory joint disorder marked by cartilage degradation and immune microenvironment dysregulation. While transcriptomic studies have identified key pathways in KOA, the interplay between ferroptosis (an iron-dependent cell death mechanism) and immune dysfunction at single-cell resolution remains unexplored. This study integrates single-cell and bulk transcriptomics to dissect ferroptosis-driven immune remodeling and identify diagnostic biomarkers in KOA.
Methods: We analyzed scRNA-seq data (GSE255460, n = 11) and bulk RNA-seq cohorts (GSE114007: 20 KOA/18 controls; GSE246425: 8 KOA/4 controls). Single-cell data were processed via Seurat (QC: mitochondrial genes >3 MAD; normalization: LogNormalize; batch correction: Harmony) and annotated using CellMarker/PanglaoDB. CellChat decoded intercellular communication, SCENIC reconstructed transcriptional networks, and Monocle2 for pseudotime trajectory mapping. Immune infiltration (CIBERSORT) and a LASSO-SVM diagnostic model were validated by ROC curves. Functional enrichment (GSEA/GSVA) and immunometabolic profiling were performed.
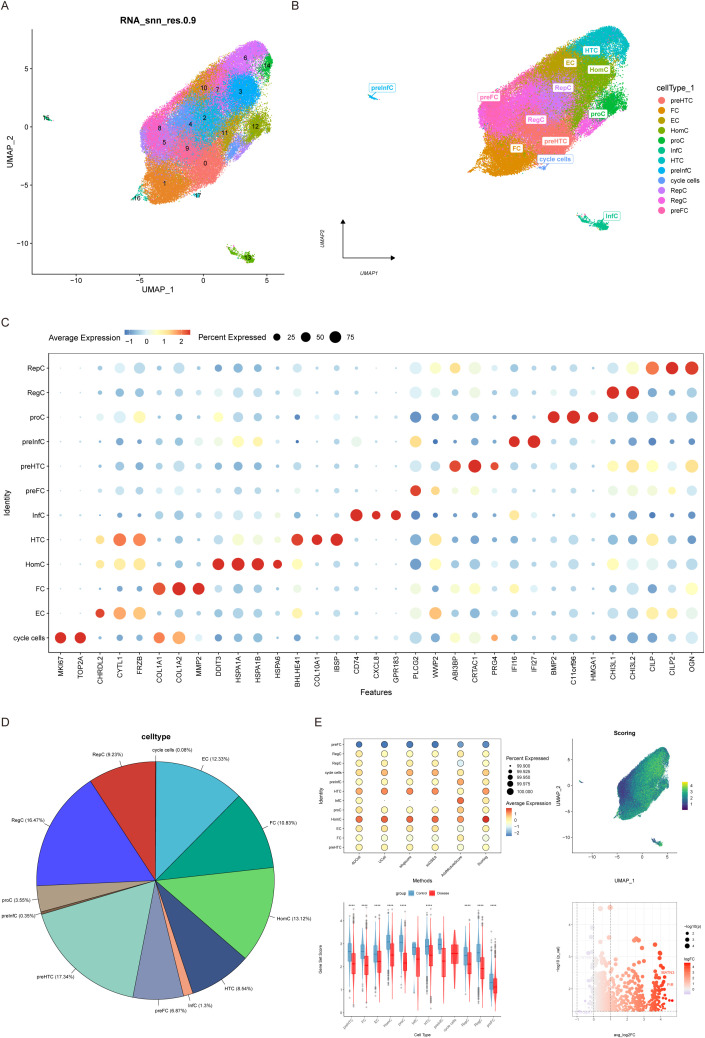
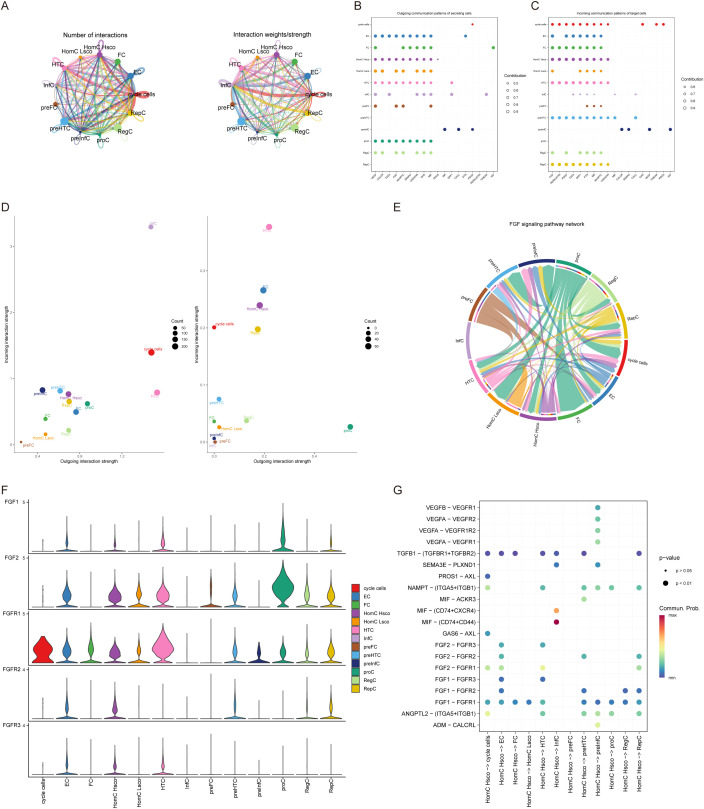
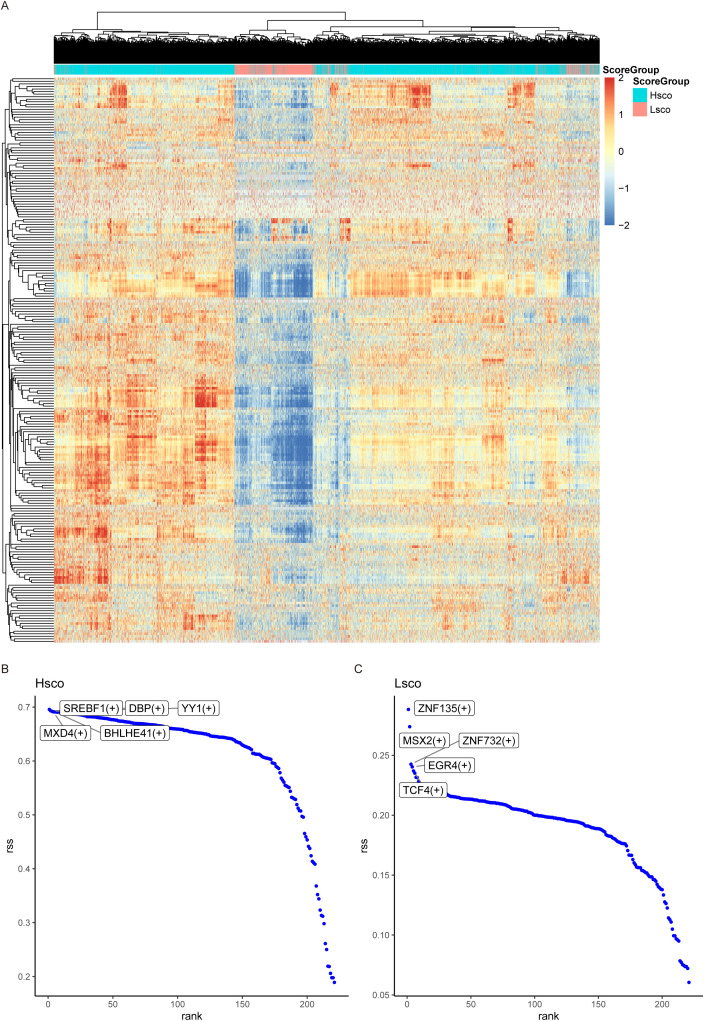
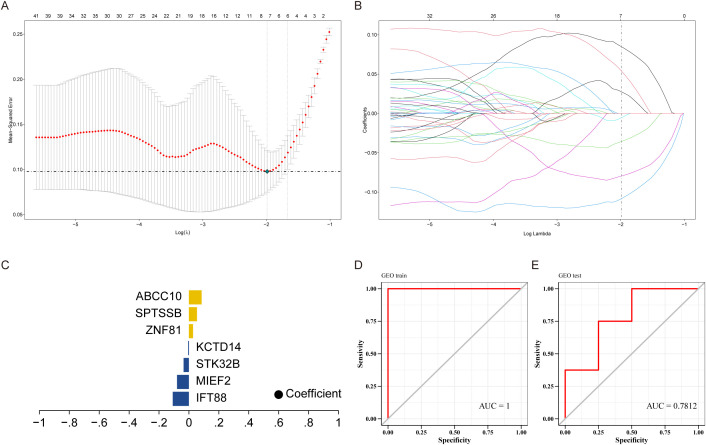
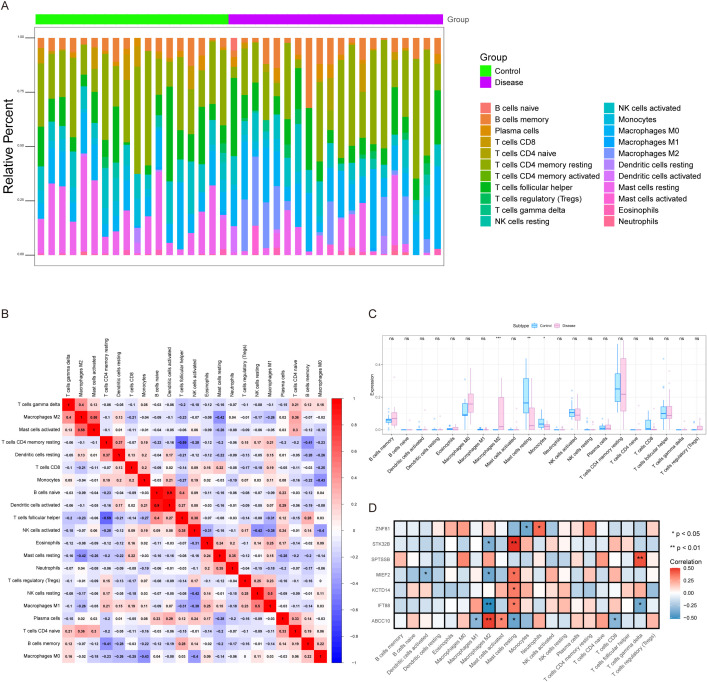
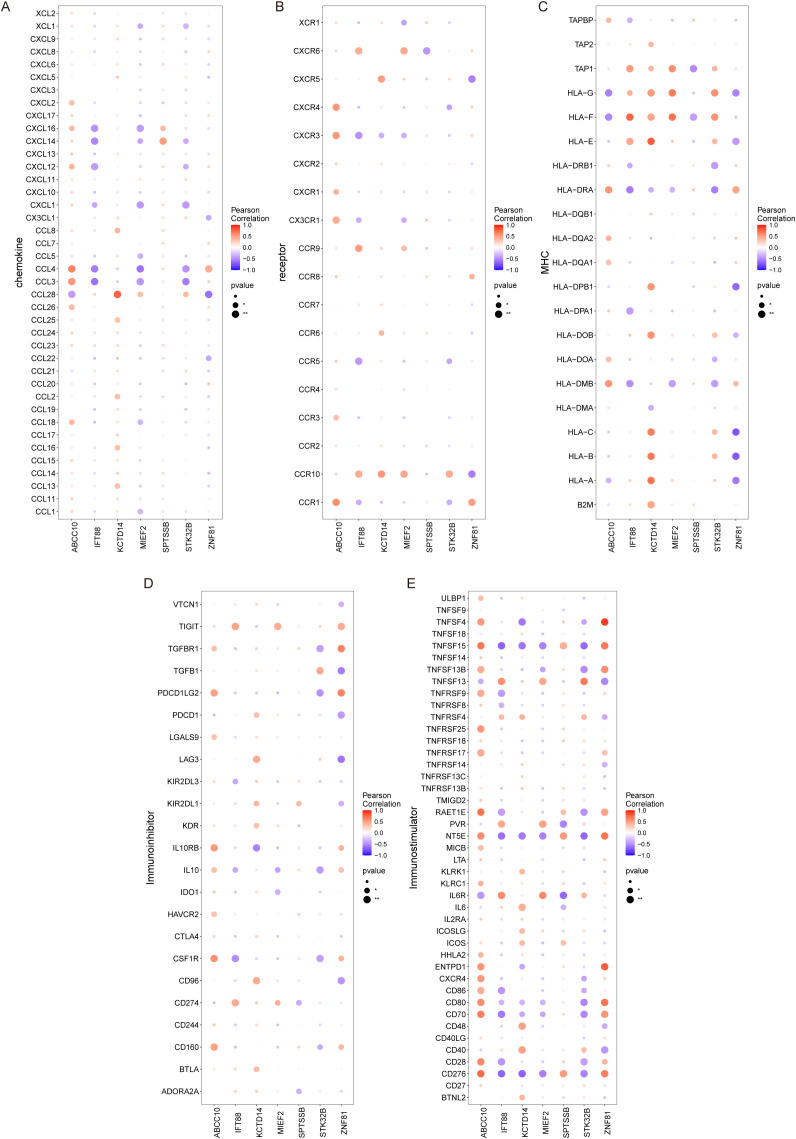
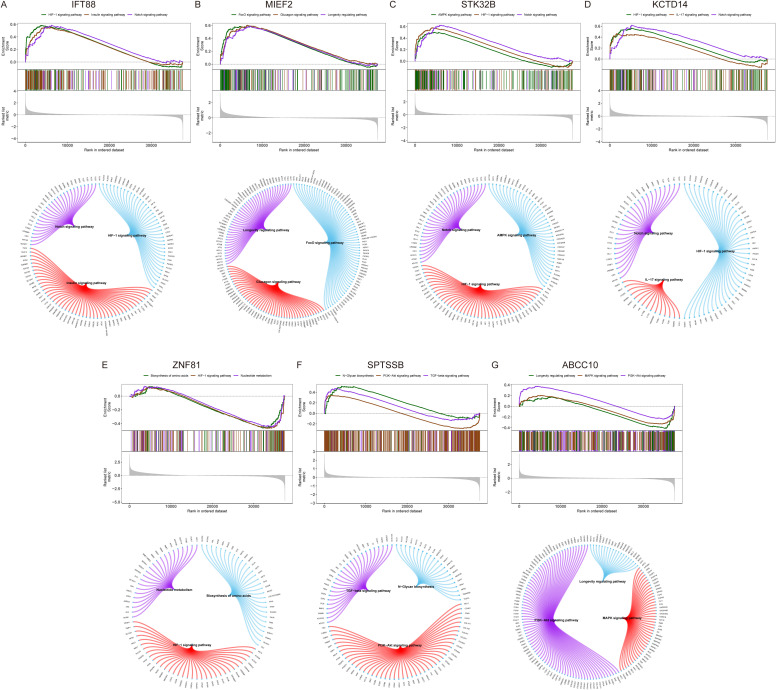
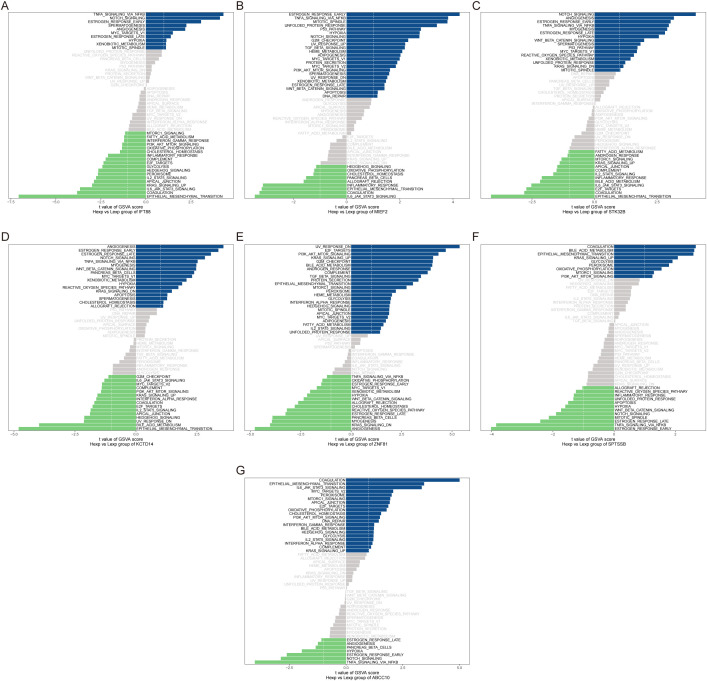
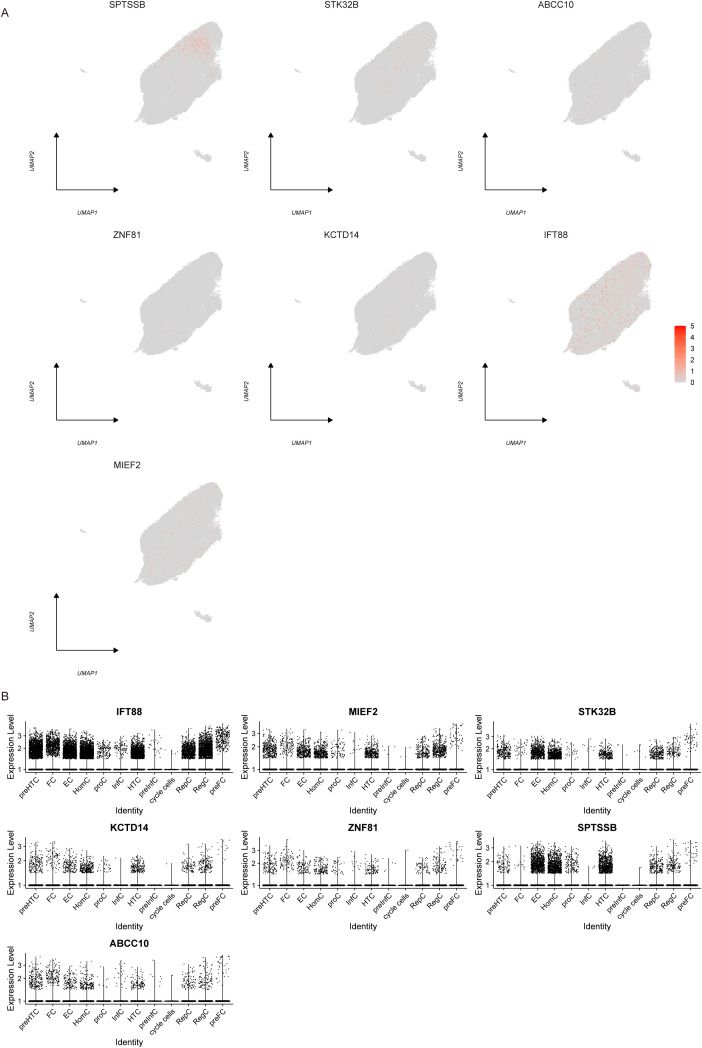
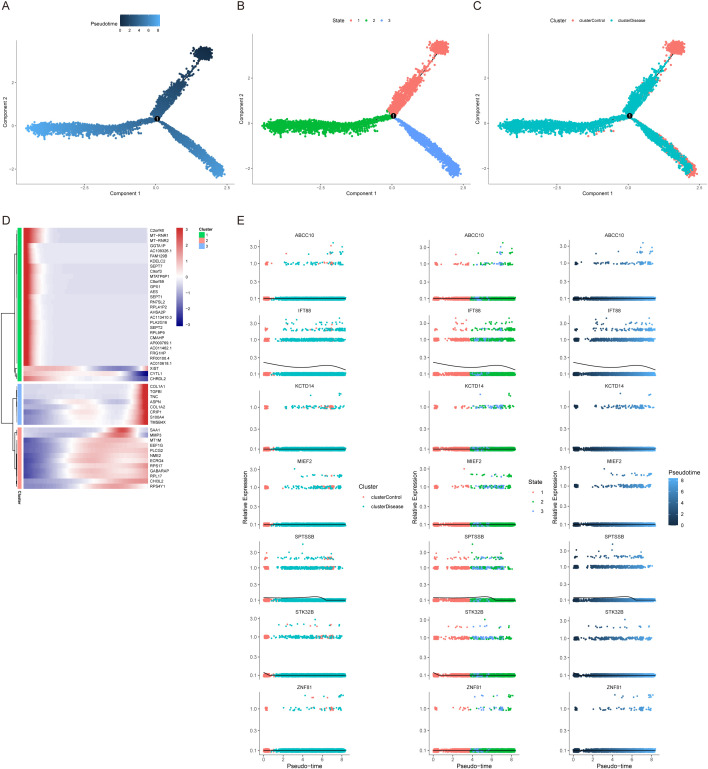
Results: Twelve chondrocyte clusters were identified, including ferroptosis-active homeostasis chondrocytes (HomC) (p < 0.01), which exhibited 491 DEGs linked to lipid peroxidation. HomC orchestrated synovitis via FGF signaling (ligand-receptor pairs: FGF1-FGFR1), amplifying ECM degradation and inflammatory cascades (CellChat). SCENIC revealed 10 HomC-specific regulons (e.g., SREBF1, YY1) driving matrix metalloproteinase activation. A 7-gene diagnostic panel (IFT88, MIEF2, ABCC10, etc.) achieved AUC = 1.0 (training) and 0.78 (validation). Immune profiling showed reduced resting mast cells (p = 0.003) and monocytes (p = 0.02), with ABCC10 correlating negatively with CD8+ T cells (r = -0.65) and M1 macrophages. GSEA/GSVA implicated HIF-1, NF-κB, and oxidative phosphorylation pathways in KOA progression. Pseudotime analysis revealed fibrotic transitions (COL1A1↑, TNC↑) in late-stage KOA cells.
Conclusion: This study establishes ferroptosis as one of the key drivers immune-metabolic dysfunction in KOA, with HomC acting as a hub for FGF-mediated synovitis and ECM remodeling. The diagnostic model and regulon network (SREBF1/YY1) offer translational tools for early detection, while impaired mast cell homeostasis highlights novel immunotherapeutic targets. Our findings bridge ferroptosis, immune dysregulation, and metabolic stress, advancing precision strategies for KOA management.
Keywords: diagnostic biomarkers; ferroptosis; immune microenvironment; knee osteoarthritis; single-cell transcriptomics.
Copyright © 2025 Wu, Liu, Yu, Wang, Li and Zeng.
Conflict of interest statement
The authors declare that the research was conducted in the absence of any commercial or financial relationships that could be construed as a potential conflict of interest.
Figures
Similar articles
-
Integrated single-cell and transcriptomic analysis of bone marrow-derived metastatic neuroblastoma reveals molecular mechanisms of metabolic reprogramming.Sci Rep. 2025 Aug 5;15(1):28519. doi: 10.1038/s41598-025-13626-8. Sci Rep. 2025. PMID: 40764361 Free PMC article.
-
Integrative multi-omics analysis reveals the interaction mechanisms between gut microbiota metabolites and ferroptosis in rheumatoid arthritis.Front Immunol. 2025 Jul 9;16:1608262. doi: 10.3389/fimmu.2025.1608262. eCollection 2025. Front Immunol. 2025. PMID: 40703513 Free PMC article.
-
Combined bulk and single-cell transcriptomic analysis reveals cell-type-specific inflammatory crosstalk in pancreatic cancer.Clin Exp Med. 2025 Jul 25;25(1):263. doi: 10.1007/s10238-025-01815-8. Clin Exp Med. 2025. PMID: 40711603 Free PMC article.
-
Medicinal plants and their secondary metabolites in alleviating knee osteoarthritis: A systematic review.Phytomedicine. 2022 Oct;105:154347. doi: 10.1016/j.phymed.2022.154347. Epub 2022 Jul 18. Phytomedicine. 2022. PMID: 35914361
-
Systemic pharmacological treatments for chronic plaque psoriasis: a network meta-analysis.Cochrane Database Syst Rev. 2021 Apr 19;4(4):CD011535. doi: 10.1002/14651858.CD011535.pub4. Cochrane Database Syst Rev. 2021. Update in: Cochrane Database Syst Rev. 2022 May 23;5:CD011535. doi: 10.1002/14651858.CD011535.pub5. PMID: 33871055 Free PMC article. Updated.
References
MeSH terms
Substances
LinkOut - more resources
Full Text Sources
Research Materials
Miscellaneous