

Trends in Pediatric Blood Pressure-Lowering Prescription Fills During 2017-2023
- PMID: 40636319
- PMCID: PMC12240082
- DOI: 10.1016/j.focus.2025.100356
Trends in Pediatric Blood Pressure-Lowering Prescription Fills During 2017-2023
Abstract
Introduction: There are no national estimates for blood pressure-lowering prescription trends among the U.S. pediatric population. This study describes trends in blood pressure-lowering prescription fills among individuals aged 3-17 years by sex and age group.
Methods: Data were obtained from IQVIA's Total Patient Tracker database covering 94% of all outpatient retail prescription fills in the U.S. The key outcome was blood pressure-lowering prescription fills during 2017-2023, utilizing a list of 113 generic medications from 21 drug classes. In addition, a subset of 20 medications recommended in the 2017 American Academy of Pediatrics guideline was examined. Annual population percentage and percentage change compared with 2017 were reported, and average annual percentage change was estimated using Joinpoint regression.
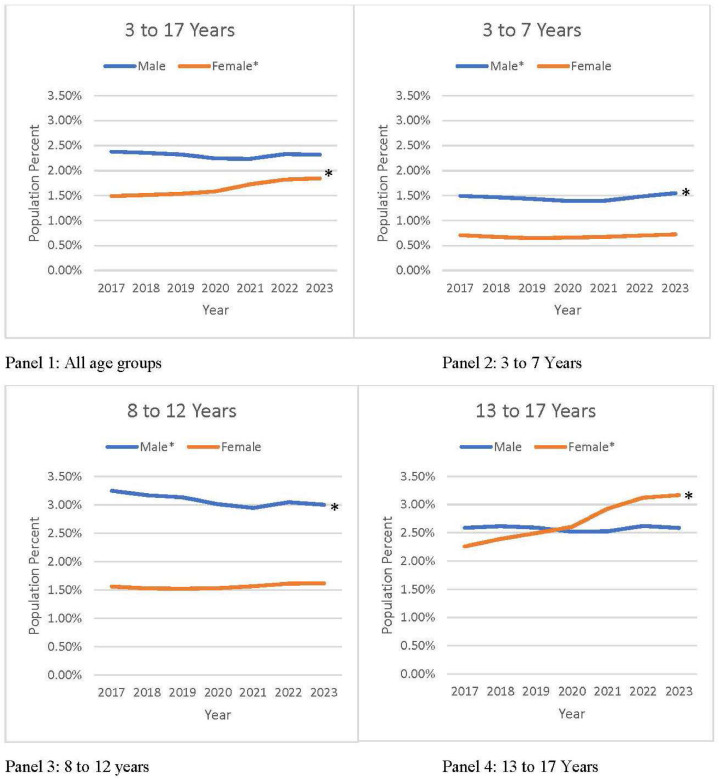
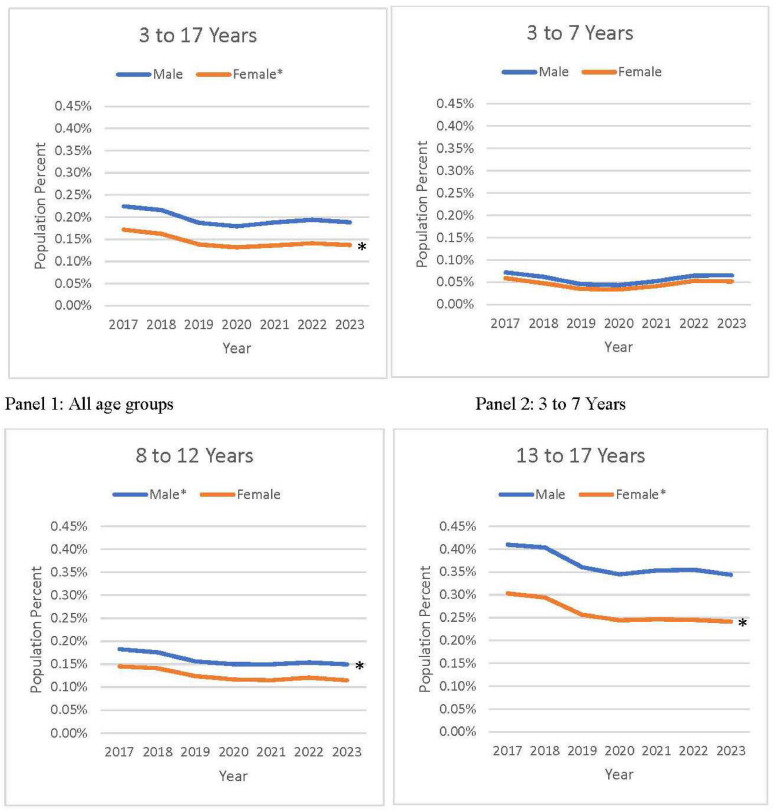
Results: From 2017 to 2023, blood pressure-lowering prescription fills among those aged 3-17 years increased slightly from 1.93% (95% CI=1.88%, 1.98%) to 2.09% (95% CI=2.04%, 2.14%). Among males, blood pressure-lowering prescription fills remained stable (between 2.32% and 2.38%; average annual percentage change= -0.3%; p=0.545), whereas fills among females increased by 23.9% (from 1.49% to 1.84%; average annual percentage change=4.16%; p<0.001). The sharpest increase occurred among females aged 13-17 years (from 2.26% to 3.17%; average annual percentage change=6.3%; p<0.001). Prescription fills for guideline-recommended medications either remained stable or declined, with some variation by sex and age group.
Conclusions: Results indicate growth in blood pressure-lowering prescription fills, especially among females aged 13-17 years. Increases were driven by medications not included in the 2017 American Academy of Pediatrics guideline, suggesting that blood pressure-lowering medications may be increasingly prescribed for conditions other than pediatric hypertension.
Keywords: Blood pressure–lowering medications; antihypertensives; blood pressure; clinical practice guideline; pediatric hypertension.
Figures
Similar articles
-
Surveillance for Violent Deaths - National Violent Death Reporting System, 50 States, the District of Columbia, and Puerto Rico, 2022.MMWR Surveill Summ. 2025 Jun 12;74(5):1-42. doi: 10.15585/mmwr.ss7405a1. MMWR Surveill Summ. 2025. PMID: 40493548 Free PMC article.
-
Sexual Harassment and Prevention Training.2024 Mar 29. In: StatPearls [Internet]. Treasure Island (FL): StatPearls Publishing; 2025 Jan–. 2024 Mar 29. In: StatPearls [Internet]. Treasure Island (FL): StatPearls Publishing; 2025 Jan–. PMID: 36508513 Free Books & Documents.
-
Perioperative medications for preventing temporarily increased intraocular pressure after laser trabeculoplasty.Cochrane Database Syst Rev. 2017 Feb 23;2(2):CD010746. doi: 10.1002/14651858.CD010746.pub2. Cochrane Database Syst Rev. 2017. PMID: 28231380 Free PMC article.
-
Multifaceted behavioral interventions to improve topical glaucoma therapy adherence in adults.Cochrane Database Syst Rev. 2025 Jun 11;6(6):CD015788. doi: 10.1002/14651858.CD015788.pub2. Cochrane Database Syst Rev. 2025. PMID: 40497459 Review.
-
Systematic review on urine albumin testing for early detection of diabetic complications.Health Technol Assess. 2005 Aug;9(30):iii-vi, xiii-163. doi: 10.3310/hta9300. Health Technol Assess. 2005. PMID: 16095545
References
LinkOut - more resources
Full Text Sources
