

Impact of a pharmacist driven antimicrobial stewardship program on inpatient antibiotic consumption in a Chinese Tertiary Hospital: a 5-year retrospective study
- PMID: 40636367
- PMCID: PMC12238102
- DOI: 10.3389/fmed.2025.1583134
Impact of a pharmacist driven antimicrobial stewardship program on inpatient antibiotic consumption in a Chinese Tertiary Hospital: a 5-year retrospective study
Abstract
Introduction: Antimicrobial Stewardship programs are crucial for reducing overall antibiotic consumption, but in practice, there are often issues with unclear responsibilities and ambiguous tasks. Pharmacists play a critical role in AMS due to their combined management functions and professional expertise.
Objective: To investigate the impact of a Pharmacist-Driven Antimicrobial Stewardship program on the consumption of antibiotics in a hospital.
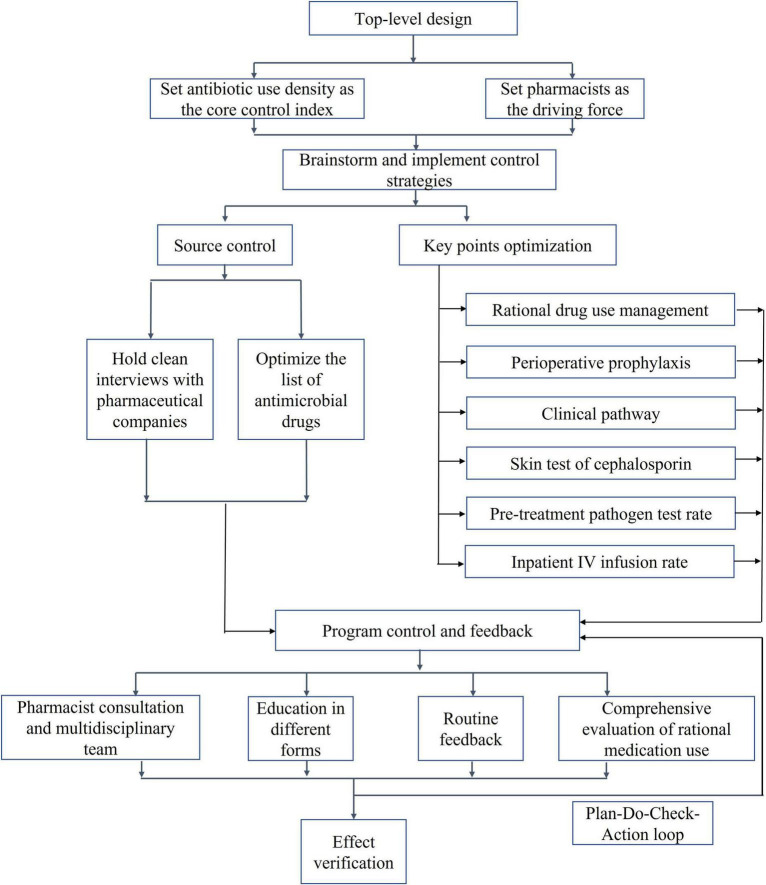
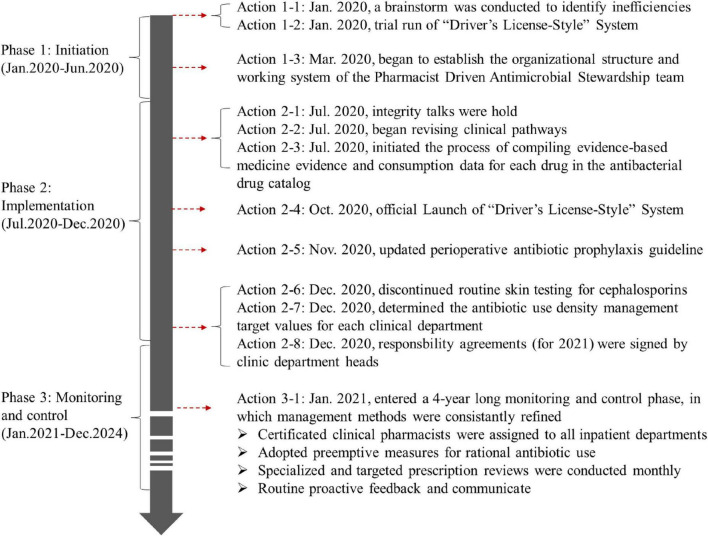
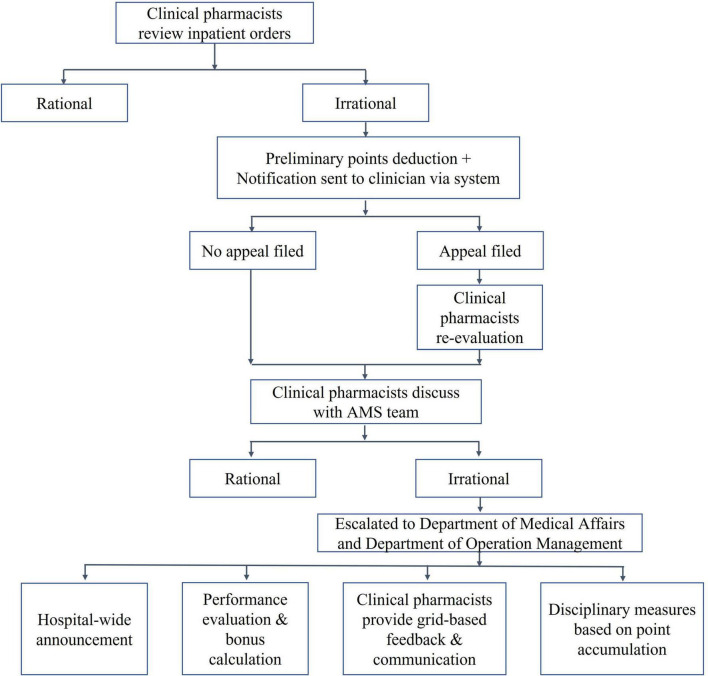
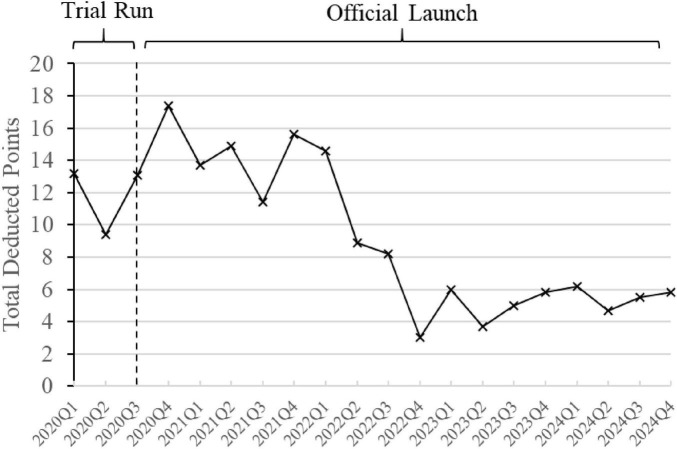
Methods: Under the support of a hospital top-level design, we implemented a Pharmacist-Driven Antimicrobial Stewardship program led by pharmacists and involving multiple disciplines. The program focused on revising the antibiotic formulary and optimizing key points of antibiotic management, using the inpatient Antibiotic Use Density as the core control indicator. This was conducted through three phases: program initiation, implementation, monitoring and control. Clinical pharmacists ensured the long-term operational quality of the program. We evaluated the impact of the program on relevant indicators of antimicrobial consumption in inpatient.
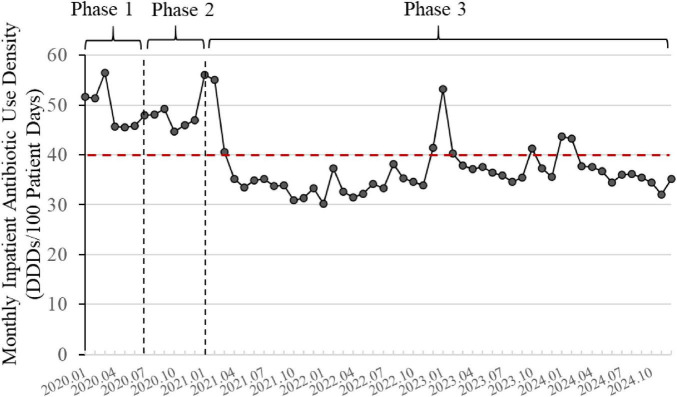
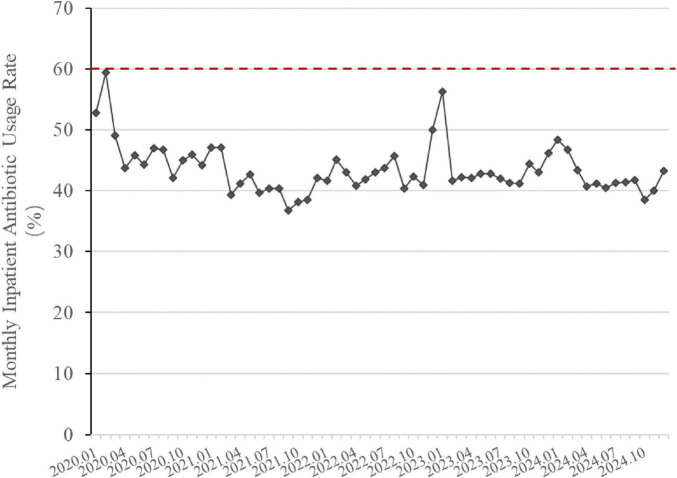
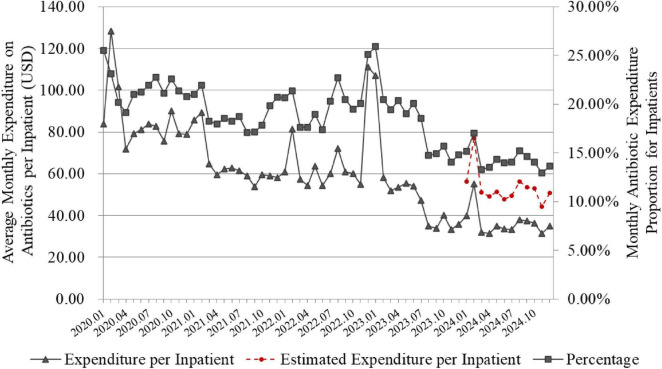
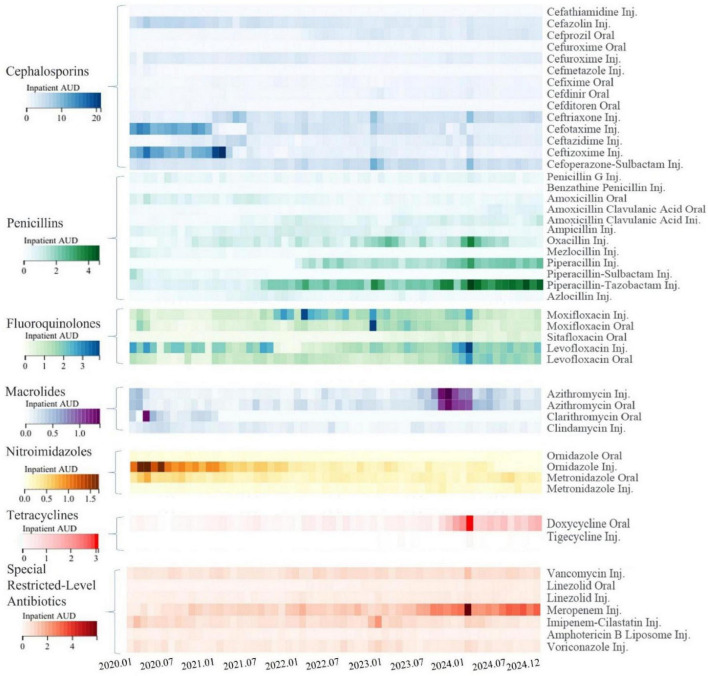
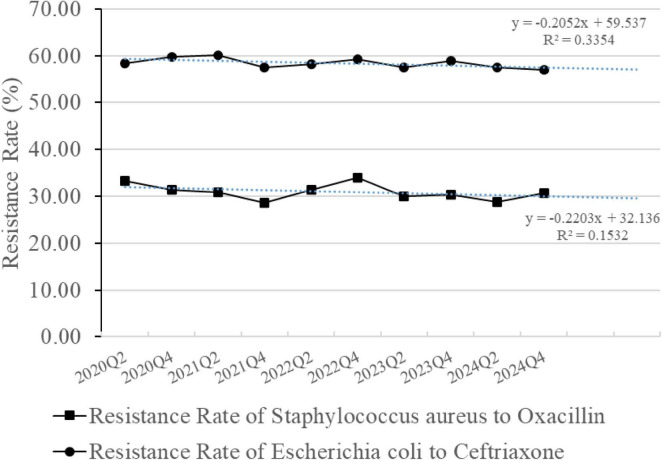
Results: Compared to the pre-implementation year of 2020, the annual Antibiotic Use Density for inpatients across the hospital decreased by 22.28% in 2024, reaching 36.26 defined daily doses/100 patient days. Additionally, the monthly inpatient Antibiotic Use Density in 2024 was significantly reduced (p < 0.001), along with the antibiotic usage rate (p < 0.05), expenditure on antibiotics per inpatient (p < 0.001), and the proportion of antibiotic expenditure relative to total for inpatients (p < 0.001). The rational use of antimicrobial agents in inpatient wards has been enhanced. Through targeted management, some antibiotics showed trends of increased or decreased usage. The detection rates of Methicillin-Resistant Staphylococcus aureus and Extended-spectrum β-lactamase-producing Escherichia coli did not show a significant decrease.
Conclusion: The Pharmacist-Driven Antimicrobial Stewardship program effectively leveraged the managerial roles and professional skills of pharmacists in rational drug use management, resulting in a significant reduction in hospital antibiotic consumption. However, to further validate its effectiveness in reversing bacterial resistance, the program requires longer-term operation and could be considered for regional expansion.
Keywords: antibiotic consumption; antibiotic use density; antimicrobial stewardship; hospital pharmacy; rational drug use.
Copyright © 2025 Qian, Yuan, Zhang, Gou, Jiang, Chen, Huang, Zhao, Du, Li, Han and Su.
Conflict of interest statement
The authors declare that the research was conducted in the absence of any commercial or financial relationships that could be construed as a potential conflict of interest.
Figures
Similar articles
-
Interventions to improve antibiotic prescribing practices for hospital inpatients.Cochrane Database Syst Rev. 2017 Feb 9;2(2):CD003543. doi: 10.1002/14651858.CD003543.pub4. Cochrane Database Syst Rev. 2017. PMID: 28178770 Free PMC article.
-
Interventions to reduce non-prescription antimicrobial sales in community pharmacies.Cochrane Database Syst Rev. 2025 Jan 29;1(1):CD013722. doi: 10.1002/14651858.CD013722.pub2. Cochrane Database Syst Rev. 2025. PMID: 39878150
-
A rapid and systematic review of the clinical effectiveness and cost-effectiveness of paclitaxel, docetaxel, gemcitabine and vinorelbine in non-small-cell lung cancer.Health Technol Assess. 2001;5(32):1-195. doi: 10.3310/hta5320. Health Technol Assess. 2001. PMID: 12065068
-
Home treatment for mental health problems: a systematic review.Health Technol Assess. 2001;5(15):1-139. doi: 10.3310/hta5150. Health Technol Assess. 2001. PMID: 11532236
-
Maximizing cost savings and clinical outcomes: A retrospective analysis of antimicrobial stewardship for meropenem utilization in Saudi Arabia.PLoS One. 2025 Jul 17;20(7):e0328673. doi: 10.1371/journal.pone.0328673. eCollection 2025. PLoS One. 2025. PMID: 40674322 Free PMC article.
References
-
- Wang Y, Zhou C, Liu C, Liu S, Liu X, Li X. The impact of pharmacist-led antimicrobial stewardship program on antibiotic use in a county-level tertiary general hospital in China: A retrospective study using difference-in-differences design. Front Public Health. (2022) 10:1012690. 10.3389/fpubh.2022.1012690 - DOI - PMC - PubMed
-
- China National Health Commission. Principles of Clinical Use of Antibiotics [in Chinese]. (2015). Available online at: https://www.gov.cn/xinwen/2015-08/27/content_2920799.htm (accessed February 25, 2025).
LinkOut - more resources
Full Text Sources