. 2023 Sep 21;3(9):100732.
doi: 10.1016/j.checat.2023.100732. Epub 2023 Aug 28.

Revealing the Catalytic Strategy of FTO

Affiliations

Revealing the Catalytic Strategy of FTO

Ann Varghese et al. Chem Catal. .

Abstract

The fat-mass and obesity-associated protein (FTO) is a Fe(II) and 2-oxoglutarate (2OG)-dependent oxygenase of the AlkB family and is linked with obesity and cancer. The enzyme is identified as single-stranded DNA/RNA demethylase with N6-methyladenine (m6A) modification in RNA as its most favorable substrate. Herein we used Molecular Dynamics (MD), metadynamics (MetD), and hybrid Quantum Mechanics/Molecular Mechanics (QM/MM) calculations to reveal the catalytic mechanism of FTO with pentanucleotide-ssRNA(m6A) substrate and elucidate the effects of clinically significant mutations R316Q and S319F. The calculations explored the catalytic mechanism of the O2 activation and substrate oxidation in the WT FTO, revealing that different networks of residues stabilize the TSs of the different reaction steps. The mutations influence the interactions in the jelly-roll motif and loops in FTO and in particular, S319F strongly affects the substrate binding. The R316Q mutant slows down the O2 activation and HAT rates in agreement with experimental studies.

Keywords: Catalysis; FTO; Molecular dynamics; Non-heme enzyme; Quantum Mechanics/ Molecular Mechanics (QM/MM); conformational study; mutations.


Conflict of interest statement

Declaration of Interests The authors declare no competing interests.

Figures

Figure 1.
Figure 1.
Secondary structure of FTO depicting the N-and C-terminal domains (blue and brown), DSBH (cyan), L1 loop (magenta), and the surface loop (yellow). The magnified image in the circle (left) shows the enzyme catalytic site.
Figure 2.
Figure 2.
Location of the mutated residues in FTO- R316 (magneta) and S319 (yellow).
Figure 3.
Figure 3.
MM MetD of substrate binding to FTO. A) Free energy profile for the binding of m6A substrate to the Fe center, B-D) Geometries of the unbound (U), TS and the bound (B) states, respectively, during the substrate binding.
Figure 4.
Figure 4.
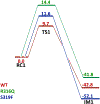
Energy profiles for O2 activation by the WT (brown) and mutants R316Q (green), and S319F (blue) with the lowest activation barriers. The relative B2+ZPE is represented in kcal/mol.
Figure 5.
Figure 5.
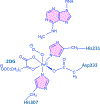
Catalytic site stabilizing residues in the wild-type (WT) ferryl complex (blue). The active site is represented in ball and stick model (yellow).
Figure 6.
Figure 6.
Stationary point geometries for the substrate oxidation including the hydrogen atom transfer (HAT) and rebound hydroxylation. The distances (Å) and spin densities are shown in brown and yellow, respectively.
Figure 7.
Figure 7.
QM/MM relative energies for the substrate oxidation by WT FTO. A) Energy profile of the reaction path for the substrate hydroxylation. The relative single point (B2) energies are represented in kcal/mol at B3LYP/def2-TZVP (blue) and B2 with ZPE (black). B) The HAT energy barriers for the five studied MD snapshots. Snapshot number 1 was used for further analysis.
Figure 8.
Figure 8.
The σ- and π-channels observed for the HAT in high spin (S=2) ferryl complexes. A) σ-channel B) π-channel.
Figure 9.
Figure 9.
Schematic molecular orbital representation of transition states involved in the substrate oxidation. A) HAT B) Rebound hydroxylation.
Figure 10.
Figure 10.
Energetics for the HAT pathway by WT (brown) and mutant R316Q (green). The relative B2+ZPE is represented in kcal/mol.
Figure 11.
Figure 11.
Energetics and stationary point geometries for the second oxidation by WT FTO. The relative single point (B2) energies are represented in kcal/mol at B3LYP/def2-TZVP (red) and B2 with ZPE (black).
Figure 12.
Figure 12.
The QM region of the FTO-2OG-ssRNA(m6A)Fe(III)-O-O.- complex used for the QM/MM calculations.
Scheme 1.
Scheme 1.
Catalytic cycle for the demethylation of m6A by FTO.

References

    1. Hill JO (2006). Understanding and Addressing the Epidemic of Obesity: An Energy Balance Perspective. Endocr. Rev 27, 750–761. 10.1210/er.2006-0032. - DOI - PubMed
    1. Hess ME, and Brüning JC (2014). The fat mass and obesity-associated (FTO) gene: Obesity and beyond? Biochim. Biophys. Acta BBA - Mol. Basis Dis 1842, 2039–2047. 10.1016/j.bbadis.2014.01.017. - DOI - PubMed
    1. Dina C, Meyre D, Gallina S, Durand E, Körner A, Jacobson P, Carlsson LMS, Kiess W, Vatin V, Lecoeur C, et al. (2007). Variation in FTO contributes to childhood obesity and severe adult obesity. Nat. Genet 39, 724–726. 10.1038/ng2048. - DOI - PubMed
    1. Loos RJF, and Bouchard C (2008). FTO: the first gene contributing to common forms of human obesity. Obes. Rev 9, 246–250. 10.1111/j.1467-789X.2008.00481.x. - DOI - PubMed
    1. Hernández-Caballero ME, and Sierra-Ramírez JA (2015). Single nucleotide polymorphisms of the FTO gene and cancer risk: an overview. Mol. Biol. Rep 42, 699–704. 10.1007/s11033-014-3817-y. - DOI - PubMed

LinkOut - more resources