

Altering the bacterial community: sour soup decreased CO2 production and improved the fermentation quality of Broussonetia papyrifera, Tritriale and mixed silages
- PMID: 40636507
- PMCID: PMC12237880
- DOI: 10.3389/fmicb.2025.1606628
Altering the bacterial community: sour soup decreased CO2 production and improved the fermentation quality of Broussonetia papyrifera, Tritriale and mixed silages
Abstract
Introduction: Carbon dioxide (CO2) generated during the ensiling process is a source of greenhouse gas emissions and a reason for the loss of nutrients during ensiling.
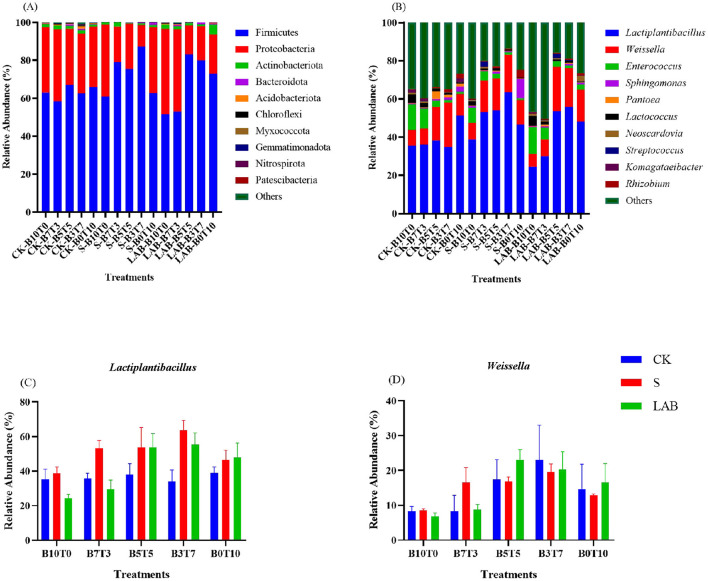
Methods: Broussonetia papyrifera (B), Tritriale (T) and their mixtures (B7T3, B5T5 and B3T7) were ensiled with sour soup (S) and Lactobacillus acidophilus (LAB) to investigate the effects of additives on silage quality, CO2 production and bacterial communities.
Results: After 45 days of fermentation, the B3T7 treatment resulted in the lowest CO2 production, a relatively high lactic acid content (pH < 4.2), and relatively high relative abundances of Lactiplantibacillus and Weissella after fermentation; the quality of silage in all the treatments with additives was greater than that in the CK treatment, and the CO2 content was significantly lower than that in the CK treatment (P < 0.05). In addition, the overall silage quality was better than that of CK after the addition of additives, the CO2 content was significantly lower (P < 0.05), and adding sour soup resulted in a greater effect than adding LAB. CO2 production was positively correlated with the relative abundances of Lactococcus, Enterococcus, and Neoscardovia and negatively correlated with the relative abundances of Lactiplantibacillus, Weissella, and Sphingomonas.
Conclusions: In summary, selecting an appropriate proportion of different forages for mixed silage and adding sour soup may be effective ways to improve silage quality and reduce CO2 production during ensiling.
Keywords: bacterial communities; carbon dioxide; fermentation; silage; sour soup.
Copyright © 2025 Cheng, Liu, Lei, Li, Chen, Wang, He, Zhao, Chen and Zhang.
Conflict of interest statement
The authors declare that the research was conducted in the absence of any commercial or financial relationships that could be construed as a potential conflict of interest.
Figures

Similar articles
-
Fermentation Characteristics, Nutrient Content, and Microbial Population of Silphium perfoliatum L. Silage Produced with Different Lactic Acid Bacteria Additives.Animals (Basel). 2025 Jul 2;15(13):1955. doi: 10.3390/ani15131955. Animals (Basel). 2025. PMID: 40646854 Free PMC article.
-
Exploring the aerobic stability, antioxidant and microbial community of Broussonetia papyrifera ensiled with ferulic acid esterase-producing Lactiplantibacillus plantarum in combination with cellulase and/or xylanase.BMC Microbiol. 2025 Aug 23;25(1):533. doi: 10.1186/s12866-025-04185-z. BMC Microbiol. 2025. PMID: 40847280 Free PMC article.
-
Enhancing alfalfa and sorghum silage quality using agricultural wastes: fermentation dynamics, microbial communities, and functional insights.BMC Plant Biol. 2025 May 30;25(1):728. doi: 10.1186/s12870-025-06722-4. BMC Plant Biol. 2025. PMID: 40442596 Free PMC article.
-
The Black Book of Psychotropic Dosing and Monitoring.Psychopharmacol Bull. 2024 Jul 8;54(3):8-59. Psychopharmacol Bull. 2024. PMID: 38993656 Free PMC article. Review.
-
Intravenous magnesium sulphate and sotalol for prevention of atrial fibrillation after coronary artery bypass surgery: a systematic review and economic evaluation.Health Technol Assess. 2008 Jun;12(28):iii-iv, ix-95. doi: 10.3310/hta12280. Health Technol Assess. 2008. PMID: 18547499
References
-
- Adegbeye M. J., Elghandour M. M., Monroy J. C., Abegunde T. O., Salem A. Z., Barbabosa-Pliego A., et al. (2019). Potential influence of Yucca extract as feed additive on greenhouse gases emission for a cleaner livestock and aquaculture farming-a review. J. Clean Prod. 239:118074. 10.1016/j.jclepro.2019.118074 - DOI
-
- AOAC . (1990). Official Methods of Analysis. Arlington: Association of Official Analytical Chemists.
-
- Arthur Thomas T. (1977). An automated procedure for the determination of soluble carbohydrates in herbage. J. Sci. Food Agric. 28, 639–642. 10.1002/jsfa.2740280711 - DOI
-
- Bishop P., Pitts E. R., Budner D., Thompson-Witrick K. A. (2022). Kombucha: Biochemical and microbiological impacts on the chemical and flavor profile. Food Chem. Adv. 1:100025. 10.1016/j.focha.2022.100025 - DOI
LinkOut - more resources
Full Text Sources
Research Materials
Miscellaneous