. 2025;6(1):536.
doi: 10.1038/s43247-025-02493-w. Epub 2025 Jul 8.

Intensifying tropical cyclones in the Arabian Sea replenish depleting aquifers

Affiliations

Intensifying tropical cyclones in the Arabian Sea replenish depleting aquifers

Hassan Saleh et al. Commun Earth Environ. 2025.

Abstract

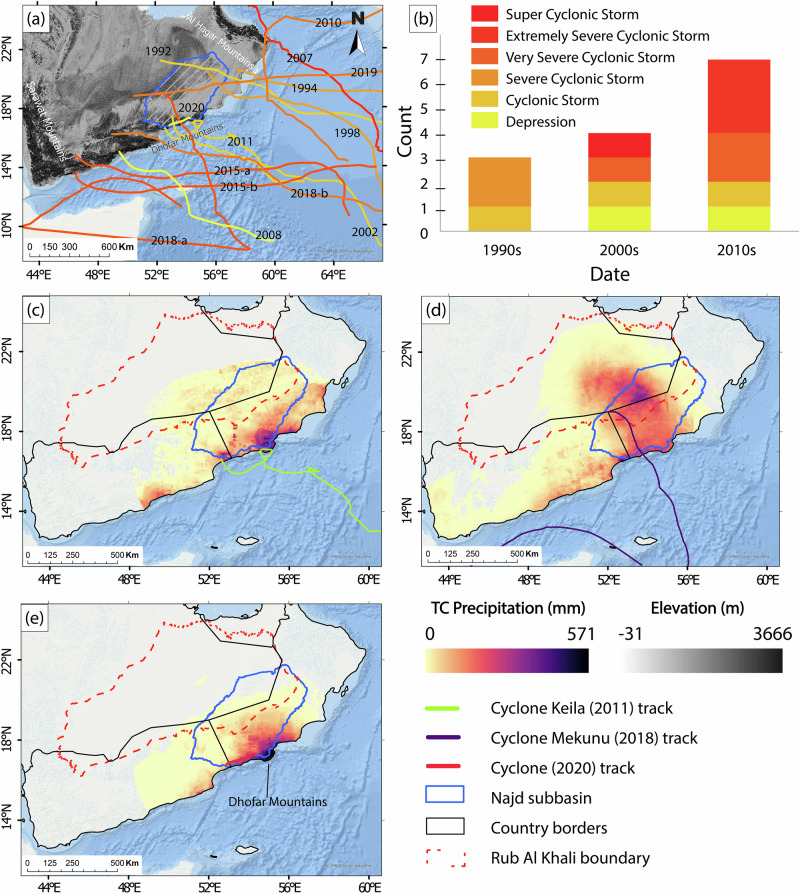
Tropical cyclones intensified globally in recent decades, delivering extreme precipitation deeper inland. While much research has focused on the role of climate change in tropical cyclone intensification, less is known about their contribution to groundwater recharge, especially in arid regions where freshwater is scarce and aquifers are being depleted. Here we quantify cyclone-driven groundwater recharge across the Arabian Peninsula from 2002 to 2021 using satellite-based total water storage and hydrodynamic modeling. Findings show that cyclones contributed up to 60% of total precipitation in the southern Arabian Peninsula. Cyclone Mekunu (2018) alone delivered 30 km3 of precipitation inland, resulting in a net groundwater recharge of 3.2 ± 1.2 km3 in the Najd subbasin. These findings reveal that tropical cyclones play a crucial role in replenishing groundwater resources in arid regions. Our approach provides a framework for quantifying recharge in ungauged arid basins worldwide, offering valuable insights for climate-resilient water resource management.

Keywords: Governance; Hydrology.


Conflict of interest statement

Competing interestsThe authors declare no competing interests.

Figures

Fig. 1
Fig. 1. Tropical cyclones impacting the Arabian Peninsula.
a Tracks and intensities of TCs that made landfall in southern AP between 1990 and 2020, with landfall years labeled. TC maximum intensity is color-coded from yellow (lowest intensity) to red (highest intensity). b Stacked bar plot of TC’s decadal frequency and intensity. c Cumulative precipitation from Cyclone Keila (31 Oct–8 Nov 2011). d Cumulative precipitation from Cyclone Mekunu (24–30 May 2018). e Cumulative precipitation from Cyclone 2020 (29 May–3 Jun 2020). The Rub Al Khali desert is outlined in red dashed lines, and the Najd subbasin in blue solid lines.
Fig. 2
Fig. 2. Spatial distribution of TC precipitation over the Arabian Peninsula and its seasonal contribution over the Najd subbasin.
a Total TCP across the southern AP between April 2002 and September 2021 showing maximum accumulation over the Najd subbasin (outlined in blue), which comprises part of the Rub Al Khali desert (outlined in red dashed lines). TC intensity is color-coded from yellow (lowest accumulation) to black (highest accumulation). b Percentage of total precipitation attributed to TCs during the same period, with the highest relative contributions over the Najd subbasin. TC contribution is color-coded from yellow (lowest percentage) to black (highest percentage). c Comparison of seasonal precipitation contributions, monsoon (green bars), winter (blue bars), and TC (red bars), to the annual precipitation (black dashed line) in the Najd subbasin.. Three major cyclones impacted the Najd subbasin during the study period: Cyclone Keila (2011), Cyclone Mekunu (2018), and Cyclone (2020).
Fig. 3
Fig. 3. GRACETWS trends and responses to TCs over the Najd subbasin.
a Time series of monthly terrestrial water storage anomalies from three GRACE solutions (CSR, JPL, and GSFC) and their ensemble mean. Monthly precipitation is shown in blue bars, with vertical dashed grey lines representing months during which TC impacted the Najd. Linear trends are shown in a red dotted line (period 1) and a black dotted line (period 2). b Detrended GRACETWS anomalies for each solution and the ensemble mean. Horizontal black dashed lines indicate the mean change in GRACETWS for the year preceding and following each of the three major TCs (Keila, Mekunu, and Cyclone 2020).
Fig. 4
Fig. 4. GRACE-derived groundwater storage changes following the landfall of three major TCs.
One-year difference images of mean GRACETWS (CSR solution) for (a) Cyclone Keila, (b) Cyclone Mekunu, and (c) Cyclone 2020. The maps depict recharge signals over the Najd subbasin and surrounding regions. Confined aquifers crop out in the upstream area. Green contour lines represent elevation, and blue lines show the tracks of the three cyclones.
Fig. 5
Fig. 5. GWL dynamics and responses to recharge in the central Najd region.
a Groundwater flow directions based on pre-2011 GWL measurements from monitoring wells and boreholes, modified from Al-Mashaikhi (2011). GWLs in aquifer C are depicted by purple contour lines, and confined aquifer outcrops are shown in green polygons. b Spatial changes in GWL between March 2018 (before Cyclone Mekunu) and August 2021 (after Cyclone 2020). The blue solid circle marks the location of unconfined aquifer wells, open triangles show locations of confined aquifer wells, and orange solid circles show locations of wells where tritium was detected. The red dashed line represents the speculated groundwater flow barrier between Hanfit and Helat Ar Raka. c Time series of GWL from unconfined aquifer wells. Vertical dashed lines represent the months when the three major TCs made landfall. d Time series of GWL from confined aquifer wells. e Relationship between the distance of monitoring wells from the confined aquifer outcrops and the maximum GWL rise following Cyclone Mekunu.
Fig. 6
Fig. 6. Comparison of modeled and observed runoff travel distances for cyclones impacting the Najd subbasin.
a 1:1 scatterplot comparing modeled and observed distances for two wadis across the three simulated tropical cyclones. The inset table shows statistical evaluation metrics including NSE, R-squared, and PBIAS. b Residual errors between observed and modeled runoff travel distances for Cyclones Keila (2011), Mekunu (2018), and Cyclone (2020).
Fig. 7
Fig. 7. Simulated soil evaporation by soil type following cyclone landfall.
ac Accumulated soil evaporation (km3) simulated by the SEC model for Cyclone Keila (2011), Cyclone Mekunu (2018), and Cyclone (2020). Results are grouped by soil type within the Najd subbasin. Blue lines represent dunes, orange lines represent karstified carbonates, green lines represent carbonates, and red lines represent alluvium. The black dashed line indicates total accumulated soil evaporation.

References

    1. Kossin, J. P., Knapp, K. R., Olander, T. L. & Velden, C. S. Global increase in major tropical cyclone exceedance probability over the past four decades. Proc. Natl. Acad. Sci. USA. 117, 11975–11980 (2020). - PMC - PubMed
    1. Kumar, S. P., Roshin, R. P., Narvekar, J., Kumar, P. K. D. & Vivekanandan, E. Response of the Arabian Sea to global warming and associated regional climate shift. Mar. Environ. Res.68, 217–222 (2009). - PubMed
    1. Deshpande, M. et al. Changing status of tropical cyclones over the north Indian Ocean. Clim. Dyn.57, 3545–3567 (2021).
    1. Rios Gaona, M. F., Villarini, G., Zhang, W. & Vecchi, G. A. The added value of IMERG in characterizing rainfall in tropical cyclones. Atmospheric Res209, 95–102 (2018).
    1. Terry, J., Al Ruheili, A., Boldi, R., Gienko, G. & Stahl, H. Cyclone Shaheen: the exceptional tropical cyclone of October 2021 in the Gulf of Oman. Weather77, 364–370 (2022).

LinkOut - more resources