

Electrocardiographic T-wave Abnormalities and Premature Ventricular Contraction Burden in Patients With Palpitations: A Regional Study From Northeast India
- PMID: 40636658
- PMCID: PMC12240451
- DOI: 10.7759/cureus.85629
Electrocardiographic T-wave Abnormalities and Premature Ventricular Contraction Burden in Patients With Palpitations: A Regional Study From Northeast India
Abstract
Background: Premature ventricular contractions (PVCs), often presenting as palpitations, are common in cardiology outpatient settings. While a high PVC burden is linked to adverse cardiac outcomes, its detection typically requires 24-hour Holter monitoring - an investigation not always feasible in resource-limited settings. Electrocardiographic (ECG) markers of ventricular repolarization, represented by T-wave abnormalities, such as Tp-Te interval, Tp-Te/QT ratio, and QTc dispersion, may serve as accessible surrogate indicators of PVC burden.
Objective: To evaluate the correlation between surface ECG-derived repolarization markers and PVC burden and determine which parameters best predict higher PVC burden in patients presenting with palpitations.
Methodology: A total of 87 adult patients with palpitations referred to a tertiary care cardiology clinic in Northeast India underwent 12-lead ECG and 24-hour Holter monitoring. Patients were stratified into two groups based on PVC burden (<1% vs. >1%). ECG parameters, including T-wave axis angle, frontal QRS-T (fQRS-T) angle, Tp-Te interval, Tp-Te dispersion, Tp-Te/QT ratio, and QTc dispersion, were compared. Statistical analysis included Welch's t-test and Spearman's correlation.
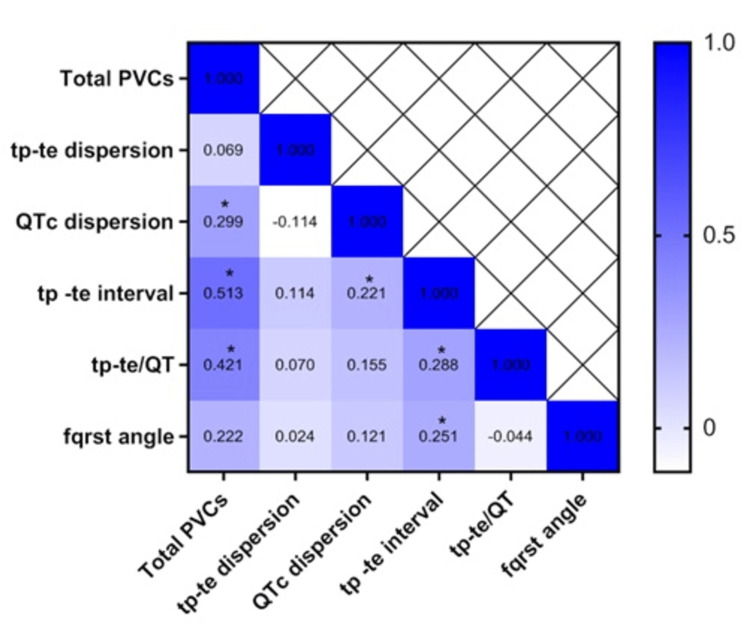
Results: Tp-Te interval (r = 0.5), Tp-Te/QT ratio (r = 0.4), and QTc dispersion (r = 0.3) demonstrated significant positive correlations with total PVC burden. These parameters were also significantly higher in the >1% PVC burden group (P < 0.05). No significant correlation was observed with T-wave axis or fQRS-T angle.
Conclusions: Among surface ECG markers studied, Tp-Te interval, Tp-Te/QT ratio, and QTc dispersion showed the strongest correlation with PVC burden in patients presenting with palpitations. These accessible and non-invasive markers may help identify patients at risk of higher PVC loads who may benefit from further evaluation, especially in settings where Holter monitoring is limited.
Keywords: ecg; holter; pvc burden; repolarization abnormalities; tp -te interval.
Copyright © 2025, Bharadwaj et al.
Conflict of interest statement
Human subjects: Consent for treatment and open access publication was obtained or waived by all participants in this study. All India Institute of Medical Sciences, Guwahati issued approval AIIMSG/IEC/M2/P10/2023. Animal subjects: All authors have confirmed that this study did not involve animal subjects or tissue. Conflicts of interest: In compliance with the ICMJE uniform disclosure form, all authors declare the following: Payment/services info: All authors have declared that no financial support was received from any organization for the submitted work. Financial relationships: All authors have declared that they have no financial relationships at present or within the previous three years with any organizations that might have an interest in the submitted work. Other relationships: All authors have declared that there are no other relationships or activities that could appear to have influenced the submitted work.
Figures

Similar articles
-
A retrospective study of electrocardiographic alterations in primary Sjögren's syndrome: role of anti-SSA positivity and disease duration.Clin Rheumatol. 2025 Jun;44(6):2377-2386. doi: 10.1007/s10067-025-07477-x. Epub 2025 May 10. Clin Rheumatol. 2025. PMID: 40346441
-
Three-Day Monitoring of Adhesive Single-Lead Electrocardiogram Patch for Premature Ventricular Complex: Prospective Study for Diagnosis Validation and Evaluation of Burden Fluctuation.J Med Internet Res. 2024 Mar 21;26:e46098. doi: 10.2196/46098. J Med Internet Res. 2024. PMID: 38512332 Free PMC article.
-
Electrocardiographic Markers of Sudden Unexpected Death Risk in Pediatric Epilepsy: A Comparative Study of Generalized and Focal Seizures.Diagnostics (Basel). 2025 Jun 26;15(13):1622. doi: 10.3390/diagnostics15131622. Diagnostics (Basel). 2025. PMID: 40647621 Free PMC article.
-
Signs and symptoms to determine if a patient presenting in primary care or hospital outpatient settings has COVID-19.Cochrane Database Syst Rev. 2022 May 20;5(5):CD013665. doi: 10.1002/14651858.CD013665.pub3. Cochrane Database Syst Rev. 2022. PMID: 35593186 Free PMC article.
-
The Black Book of Psychotropic Dosing and Monitoring.Psychopharmacol Bull. 2024 Jul 8;54(3):8-59. Psychopharmacol Bull. 2024. PMID: 38993656 Free PMC article. Review.
References
-
- Relationship between burden of premature ventricular complexes and left ventricular function. Baman TS, Lange DC, Ilg KJ, et al. Heart Rhythm. 2010;7:865–869. - PubMed
-
- PVC-induced cardiomyopathy: the cut-off value for the premature ventricular complex burden. Ban JE, Kim YH. Europace. 2013;15:1063–1064. - PubMed
-
- Cellular basis for QT dispersion. Antzelevitch C, Shimizu W, Yan GX, Sicouri S. J Electrocardiol. 1998;30:168–175. - PubMed
-
- Recent ventricular repolarization markers in resistant hypertension: are they different from the traditional QT interval? Salles GF, Cardoso CR, Leocadio SM, Muxfeldt ES. Am J Hypertens. 2008;21:47–53. - PubMed
LinkOut - more resources
Full Text Sources