. 2025 Jul 31;39(14):e70819.
doi: 10.1096/fj.202500763R.

Nuclear Receptor ERRγ Protects Against Cardiac Ischemic Injury by Suppressing GBP5-Mediated Myocardial Inflammation

Affiliations

Nuclear Receptor ERRγ Protects Against Cardiac Ischemic Injury by Suppressing GBP5-Mediated Myocardial Inflammation

Junhao Qiu et al. FASEB J. .

Abstract

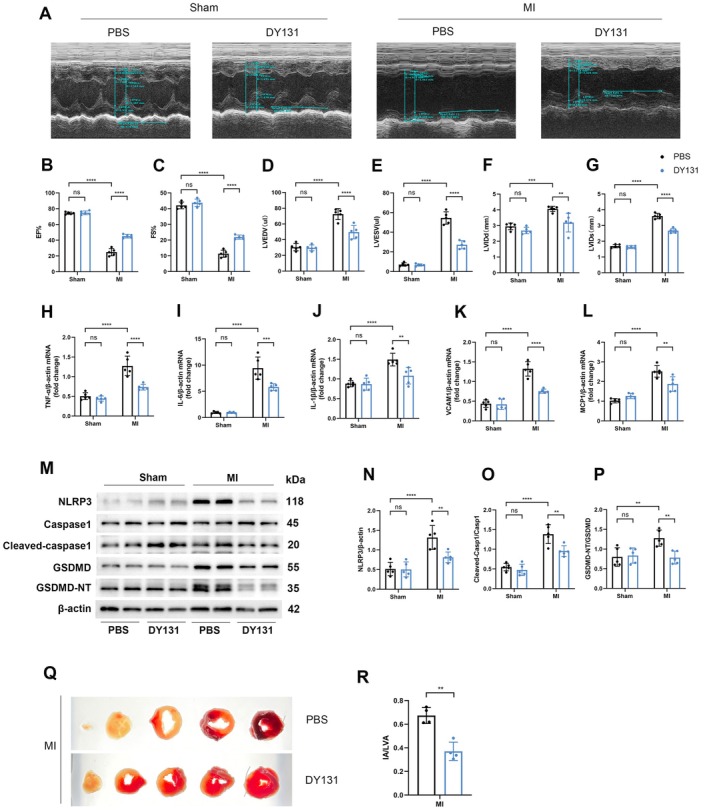
Myocardial inflammation plays a critical role in the progression of injury following myocardial infarction (MI), yet the transcriptional mechanisms regulating cardiomyocyte inflammation to mitigate post-ischemic injury remain poorly understood. This study elucidated the role of Estrogen-Related Receptor Gamma (ERRγ) in modulating the inflammatory response post-MI, demonstrating that ERRγ expression was downregulated in ischemic tissue and hypoxic neonatal mouse ventricular myocytes (NMVMs). Cardiomyocyte-specific overexpression of ERRγ reduced infarct size, improved cardiac function, and suppressed excessive myocardial inflammation and pyroptosis by binding to the GBP5 promoter, thereby inhibiting GBP5 transcription and reducing NLRP3 inflammasome assembly. The protective effects of ERRγ overexpression were reversed by overexpressing GBP5, and the ERRγ agonist DY131 also improved cardiac function after MI. These findings suggest that ERRγ activation reduces myocardial ischemic injury by regulating cardiomyocyte inflammation and pyroptosis, highlighting ERRγ as a potential novel therapeutic target for attenuating post-MI injury.

Keywords: ERRγ; GBP5; inflammation; myocardial infarction; pyroptosis.


Conflict of interest statement

The authors declare no conflicts of interest.

Figures

FIGURE 1
FIGURE 1
ERRγ expression is downregulated following MI. (A, B) Western blot analysis of ERRγ levels in the border zone and infarct zone at Days 1, 3, and 7 post‐MI in mice, compared to sham controls, with corresponding quantification. n = 4. (C) ERRγ protein expression in neonatal mouse ventricular myocytes (NMVMs) at 0, 3, 6, 12, 24, and 48 h post‐hypoxia. n = 4. (D) Immunofluorescence co‐staining of ERRγ, cTnT, and DAPI in MI hearts. n = 4. Scale bar = 100 μm. Data are presented as mean ± SD. Data in (A–C) were analyzed by one‐way ANOVA with Bonferroni's multiple comparison test. Data in (D) were analyzed by two‐tailed Student's t‐test. *p < 0.05, **p < 0.01, ***p < 0.001.
FIGURE 2
FIGURE 2
ERRγ attenuates cardiac injury following MI. (A) Experimental timeline and design for AAV9‐cTnT‐GFP and AAV9‐cTnT‐ERRγ administration in C57BL/6J mice. (B, C) ERRγ expression levels were assessed in AAV9‐cTnT‐GFP and AAV9‐cTnT‐ERRγ infected mice using WB, with corresponding quantification. n = 3. (D) Representative echocardiography images of MI mice 7 days post‐infection with AAV9‐cTnT‐GFP or AAV9‐cTnT‐ERRγ. (E–J) Echocardiographic analysis of LV ejection fraction (LVEF), fractional shortening (FS), left ventricular end‐diastolic volume (LVEDV), left ventricular end‐systolic volume (LVESV), left ventricular end‐diastolic dimension (LVIDd), and end‐systolic dimension (LVIDs). n = 4. (K, L) Infarct size quantified by TTC staining as a percentage of ventricular area (post MI 3 day). n = 4. Data are presented as mean ± SD. Data in (E–J) were analyzed by one‐way ANOVA with Bonferroni's multiple comparison test. Data in (C, L) were analyzed by two‐tailed Student's t‐test. *p < 0.05, **p < 0.01, and ****p < 0.0001.
FIGURE 3
FIGURE 3
ERRγ reduces inflammation and pyroptosis in hypoxic cardiomyocytes. (A, B) CCK8 assay of cell viability in Adv‐ERRγ or Si‐ERRγ NMVMs post‐hypoxia. (C, D) KEGG and GSEA analyses of RNA‐seq data from Adv‐ERRγ and Adv‐GFP infected NMVMs under hypoxic conditions. (E–H) NMVMs were transfected with Adv‐GFP or Adv‐ERRγ for 48 h, followed by hypoxia. mRNA levels of TNF‐α, IL‐6, IL‐1β, and MCP1 were measured by qRT‐PCR. n = 4. (I–L) mRNA levels of TNF‐α, IL‐6, IL‐1β, and MCP1 in Si‐NC or Si‐ERRγ NMVMs under hypoxia. (M–P) Representative Western blots and quantification of NLRP3, Caspase1, cleaved‐caspase1, GSDMD, and GSDMD‐NT in NMVMs after Adv‐GFP or Adv‐ERRγ transfection and hypoxic exposure. n = 4. (Q–T) Western blot results of the same proteins in Si‐GFP or Si‐ERRγ NMVMs under hypoxia. Data are shown as mean ± SD. Data in (A,B, E–L, N–P, R–T) were analyzed by one‐way ANOVA with Bonferroni's multiple comparison test. *p < 0.05, **p < 0.01, ***p < 0.001, and ****p < 0.0001.
FIGURE 4
FIGURE 4
ERRγ alleviates inflammation and pyroptosis post‐MI. Mice were treated with AAV9‐cTnT‐GFP or AAV9‐cTnT‐ERRγ 4 weeks prior to sham or LAD ligation, followed by sacrifice at 3 days post‐MI. (A–E) qRT‐PCR analysis of TNF‐α, IL‐6, IL‐1β, VCAM‐1, and MCP1 mRNA levels in infarcted and healthy hearts. n = 5. (F–I) Representative Western blots and quantification of NLRP3, Caspase1, cleaved‐caspase1, GSDMD, and GSDMD‐NT in the border zone. n = 5. Data are shown as mean ± SD. Data in (A–E, G–I) were analyzed by one‐way ANOVA with Bonferroni's multiple comparison test. **p < 0.01, ***p < 0.001, and ****p < 0.0001.
FIGURE 5
FIGURE 5
ERRγ negatively regulates GBP5 in cardiomyocytes. (A) Intersection analysis of downregulated DEGs from RNA‐seq and ChIP‐seq of ERRγ. (B–D) Effects of ERRγ overexpression or knockdown on GBP5 mRNA levels in vitro (n = 4) and in vivo (n = 5). (E) Schematic of GBP5 promoter region mutation strategy (−2000 to +50 bp). (F) Dual‐luciferase reporter assay demonstrating ERRγ binding to the GBP5 promoter to inhibit its transcription. (G–I) Effects of ERRγ overexpression or knockdown on GBP5 protein levels in vitro (n = 4) and in vivo (n = 5). Data are shown as mean ± SD. Data in (B–D, G–I, F) were analyzed by one‐way ANOVA with Bonferroni's multiple comparison test. *p < 0.05, **p < 0.01, ***p < 0.001, and ****p < 0.0001.
FIGURE 6
FIGURE 6
GBP5 reverses the inhibitory effects of ERRγ on inflammation and pyroptosis in cardiomyocytes. (A–D) mRNA levels of TNF‐α, IL‐6, IL‐1β, and MCP1 in ERRγ‐overexpressing NMVMs with or without GBP5 overexpression. (E–H) mRNA levels of TNF‐α, IL‐6, IL‐1β, and MCP1 in ERRγ‐knockdown NMVMs with or without GBP5 knockdown. (I–L) Protein levels of NLRP3, Caspase1, cleaved‐caspase1, GSDMD, and GSDMD‐NT in ERRγ‐overexpressing NMVMs with or without GBP5 overexpression. (M–P) Protein levels of the same markers in ERRγ‐knockdown NMVMs with or without GBP5 knockdown. n = 4. Data are shown as mean ± SD. Data in (A–H, J–L, N–P) were analyzed by one‐way ANOVA with Bonferroni's multiple comparison test. *p < 0.05, **p < 0.01, ***p < 0.001, and ****p < 0.0001.
FIGURE 7
FIGURE 7
The protective role of ERRγ in post‐ischemic cardiac injury is GBP5‐dependent. (A) Representative echocardiography images of MI mice 7 days post‐infection with AAV9‐cTnT‐GFP, AAV9‐cTnT‐ERRγ, or AAV9‐cTnT‐GFP + AAV9‐cTnT‐ERRγ. (B–G) Echocardiographic analysis of cardiac function in MI mice overexpressing ERRγ with or without GBP5 overexpression. n = 5. (H–L) qRT‐PCR analysis of TNF‐α, IL‐6, IL‐1β, VCAM1, and MCP1 mRNA levels in ERRγ‐overexpressing mice with or without GBP5 overexpression. n = 5. (M–P) Western blot analysis of NLRP3, Caspase1, cleaved‐caspase1, GSDMD, and GSDMD‐NT protein levels. n = 5. (Q, R) Infarct size quantified by TTC staining as a percentage of ventricular area (post MI 3 day). n = 4. Data are shown as mean ± SD. Data in (B–L, N–P, R) were analyzed by one‐way ANOVA with Bonferroni's multiple comparison test. *p < 0.05, **p < 0.01, ***p < 0.001, and ****p < 0.0001.
FIGURE 8
FIGURE 8
DY131 mimics ERRγ‐mediated anti‐inflammatory effects post‐MI. (A) Representative echocardiography images of MI mice treated with DY131 (10 mg/kg) or PBS by intraperitoneal injection at 7 days post‐MI. (B–G) Echocardiographic analysis of cardiac function in DY131 or PBS‐treated MI mice. n = 5. (H–L) qRT‐PCR analysis of TNF‐α, IL‐6, IL‐1β, VCAM1, and MCP1 mRNA levels in DY131‐ or PBS‐treated MI mice. n = 5. (M–P) Western blot analysis of NLRP3, Caspase1, cleaved‐caspase1, GSDMD, and GSDMD‐NT protein levels. n = 5. (Q, R) Infarct size quantified by TTC staining as a percentage of ventricular area (post MI 3 day). n = 4. Data are shown as mean ± SD. Data in (B–L, N–P) were analyzed by one‐way ANOVA with Bonferroni's multiple comparison test. Data in R were analyzed by two‐tailed Student's t‐test. **p < 0.01, ***p < 0.001, and ****p < 0.0001.

References

    1. de Lemos J. A., Newby L. K., and Mills N. L., “A Proposal for Modest Revision of the Definition of Type 1 and Type 2 Myocardial Infarction,” Circulation 140 (2019): 1773–1775. - PMC - PubMed
    1. Reed G. W., Rossi J. E., and Cannon C. P., “Acute Myocardial Infarction,” Lancet 389 (2017): 197–210. - PubMed
    1. Bergmann O., Bhardwaj R. D., Bernard S., et al., “Evidence for Cardiomyocyte Renewal in Humans,” Science 324 (2009): 98–102. - PMC - PubMed
    1. Olsen M. B., Gregersen I., Sandanger Ø., et al., “Targeting the Inflammasome in Cardiovascular Disease,” JACC. Basic to Translational Science 7 (2022): 84–98. - PMC - PubMed
    1. Zeng C., Wang R., and Tan H., “Role of Pyroptosis in Cardiovascular Diseases and Its Therapeutic Implications,” International Journal of Biological Sciences 15 (2019): 1345–1357. - PMC - PubMed

MeSH terms

Substances

LinkOut - more resources