. 2025 Jul 8;53(13):gkaf637.
doi: 10.1093/nar/gkaf637.

Dissecting the epigenetic regulation of the fetal hemoglobin genes to unravel a novel therapeutic approach for β-hemoglobinopathies

Affiliations

Dissecting the epigenetic regulation of the fetal hemoglobin genes to unravel a novel therapeutic approach for β-hemoglobinopathies

Simone Amistadi et al. Nucleic Acids Res. .

Abstract

Beta-hemoglobinopathies are severe genetic diseases caused by mutations affecting the production of the adult β-globin chain. The clinical severity is mitigated by the co-inheritance of mutations that reactivate the production of the fetal β-like γ-globin in adults. However, the epigenetic mechanisms underlying the adult-to-fetal hemoglobin (HbA-to-HbF) switching are still not fully understood. Here, we used epigenome editing technologies to dissect the molecular mechanisms underlying γ- and β-globin gene regulation and to develop novel potential therapeutics for β-hemoglobinopathies. Targeted removal of DNA methylation by dCas9-Tet1 (alone or together with the deposition of histone acetylation by CBP-dCas9) at the fetal promoters led to efficient and durable γ-globin reactivation, demonstrating that DNA methylation is a driver for HbF repression. This strategy, characterized by high specificity and a good safety profile, led to a substantial correction of the pathological phenotype in erythroid cells from patients with sickle cell disease.


Conflict of interest statement

S.A., L.F., and A.M. are named as inventors on a patent describing epigenome editing approaches for hemoglobinopathies (EP24315519.9: epigenetic reactivation of gamma-globin expression as a novel curative option for β-hemoglobinopathies). The remaining authors declare no competing interests.

Figures

Graphical Abstract
Graphical Abstract
Figure 1.
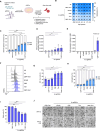
Figure 1.
Epigenetic status of the HBG promoters in adult and fetal erythroid cells. (A) ChIP-seq analysis of HBG1/2 promoters (highlighted). Epigenetic modifications include H3K27 acetylation (H3K27ac), H3K4 trimethylation (H3K4me3), H3K9 acetylation (H3K9ac), H3K27 trimethylation (H3K27me3), and H3K9 trimethylation (H3K9me3) in adult (A) and fetal erythroblasts (F). (B) Percentage of β-like globin mRNA (HBG and HBB) expression measured by RT-qPCR in adult erythroblasts at day 6 of the erythroid differentiation (Adult 1), adult erythroblasts at day 13 of the erythroid differentiation (Adult 2), edited adult erythroblasts harboring the disrupted LRF binding site (HPFH 1), edited adult erythroblasts harboring the KLF1 binding site (HPFH 2), and fetal erythroblasts (Fetal) at day 6 (circle) or day 13 (triangle) of erythroid differentiation. Of note, for 2 of the 3 fetal liver donors, we collected cells at day 13 since at day 6 the differentiation toward the erythroid lineage was delayed compared to the first donor and a relatively large fraction of the cells was not committed toward the erythroid lineage. β-like globin expression was normalized to HBA. (C) Schematic representation of the HBG gene on chromosome 11. The sequence corresponding to the LRF binding site, before and after base editing, is reported. (D) Average methylation of CpGs within the HBG promoters by bisulfite sequencing. (E) Methylation analysis of individual CpGs. All data are expressed as mean ± SD from 4 biologically independent experiments (3 adult donors for Adult 1 and HPFH 1, 3 adult donors for Adult 2 and HPFH 2, 1 fetal donor at day 6, and 2 fetal donors at day 13). Asterisks indicate level of statistical significance: **P ≤ .01; ***P ≤ .001; ****P ≤ .0001; no asterisk = not significant (unpaired t-test).
Figure 2.
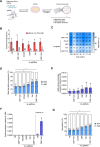
Figure 2.
HbF reactivation in the erythroid progeny of SCD HSPCs treated with epigenome editors. (A) Scheme of the experimental procedure used for experiments in non-mobilized or BM-derived SCD HSPCs. (B) Methylation analysis of CpGs within the HBG promoters by bisulfite sequencing. Cells electroporated with sgRNAs and mRNA expressing the editors were analyzed at day 13 of the erythroid differentiation. (C) Percentage of β-like globins (HBG and HBB) expression normalized to HBA expression measured by RT-qPCR at day 13 of the erythroid differentiation. (D) Fold-change increase of HBG primary transcripts normalized to HBA expression measured by RT-qPCR. (E) Cas9 expression normalized to HBA expression measured by RT-qPCR at day 13 of erythroid differentiation. HSPCs (n = 2) electroporated with TE buffer or editors collected and analyzed by RT-qPCR 3 days after transfection served as positive controls. (F) Histogram plot of HbF-positive RBCs measured by flow cytometry at day 20 of the erythroid differentiation. The two peaks in the HbF-negative population might derive from the different autofluorescence of enucleated and nucleated cell populations. (G) Percentage of HbF-positive RBCs measured by flow cytometry. (H) HbF and HbS levels measured by CE-HPLC in RBCs at day 19 of the erythroid differentiation. The percentage of each Hb type was calculated over the total Hb tetramers. (I) Frequency of sickle RBCs measured 3 h after O2 deprivation (normalized to the TE controls). (J) Representative pictures of RBCs at 20% O2 and after 3 h at 0% O2. All data are expressed as means ± standard deviation (SD) from 3 independent experiments. Each symbol represents a different donor. Asterisks indicate level of statistical significance: *P ≤ .05; **P ≤ .01; ***P ≤ .001; ****P ≤ .0001; no asterisk = not significant (unpaired t-test).
Figure 3.
Figure 3.
Progenitor counts and γ-globin reactivation in BFU-Es after epigenome editing. (A) Scheme of the experimental procedure used for experiments in BM-derived SCD HSPCs. (B) CFC frequency in control and edited samples. (C) Methylation analysis of CpGs within the HBG promoters by bisulfite sequencing in pools of BFU-E colonies (>25 colonies obtained in 3 independent experiments). (D) Percentage of β-like globins (HBG and HBB) expression normalized to HBA expression measured by RT-qPCR. (E) Fold-change increase of HBG primary transcripts normalized to HBA expression measured by RT-qPCR. (F) Cas9 expression normalized to HBA expression measured by RT-qPCR. HSPCs (n = 2) electroporated with TE buffer or editors were collected and analyzed by RT-qPCR 3 days after transfection and served as positive controls [same data as in panel (E)]. (G) HbF and HbS levels measured by CE-HPLC in BFU-Es. The percentage of each Hb type was calculated over the total Hb tetramers. All data are expressed as means ± SD from 3 independent experiments. Each symbol represents a different donor. Asterisks indicate level of statistical significance; *P ≤ .05; no asterisk = not significant (unpaired t-test).
Figure 4.
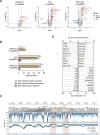
Figure 4.
Transcriptome and DNA methylome profiles of epigenome-edited HSPCs. (A) Volcano plots showing differential gene expression between cells treated with CBP + Tet1 alone (left), Tet1-4xsgRNAs (middle), and CBP + Tet1-4xsgRNAs (right) and control cells. RNA-seq was performed 72 h after electroporation in 3 different donors with SCD. The horizontal dashed line indicates the threshold on the FDR  ≤0.05, and the vertical dashed lines correspond to the threshold on log2FC  ≥1 or ≤−1. Upregulated genes are indicated in red and downregulated genes are in blue. Genes in gray are not differentially expressed. (B) Gene set enrichment analyses on Hallmark gene sets from MSigDB were performed on up-regulated DEG. The enriched Hallmark gene sets are reported. We reported the number of up-regulated genes belonging to each gene set. HM, hallmark. (C) CpG methylation profiles in a ± 25-kb genomic region centered on the TSS of HBG1. Individual dots indicate the average methylation of each CpG. Linear regression was applied to the smoothed curve (bottom panel) representing the percentage of methylation levels across the 50-kb locus encompassing HBG1 and HBG2. (D) Correlation between log2FC in gene expression of the top 10 up- and downregulated genes and their variation in DNA methylation levels. We calculated the average DNA methylation in a ± 25-kb genomic region centered on the TSS of DEGs in control versus treated cells.
Figure 5.
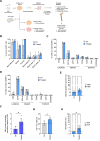
Figure 5.
Engraftment and multi-lineage differentiation of epigenome-edited HSPCs and HbF expression in their erythroid progeny. (A) Scheme of the experimental procedure used for experiments of HD HSPC xenotransplantation. Epigenome editor mRNAs and sgRNAs were co-transfected in HD HSPCs. Control and edited cells were xenotransplanted into NBSGW immunodeficient mice 1 day after transfection. Mice were euthanized 16 weeks after transplantation and their hematopoietic tissues and organs were collected and analyzed. (B) Engraftment of human cells in NBSGW mice transplanted with control (mock-transfected) or treated HSPCs 16 weeks post-transplantation (n = 3 ctr group, n= 6 treated group). Chimerism is calculated as the percentage of human CD45+ cells in the total murine and human CD45+ cell population in BM, spleen, thymus, and peripheral blood. (C) Frequency of human T (CD3) and B (CD19) lymphoid, myeloid (CD11b, CD14, and CD15), erythroid (CD235, CD36, and CD71) cells, and HSPCs (CD34) in BM and (D) spleen of mice transplanted with control and edited HSPCs 16 weeks after the transplantation (n = 3 ctr group, n= 6 treated group). (E) Percentage of β-like globin (HBG and HBB) mRNAs normalized to HBA expression and (F) fold-change increase of HBG primary transcripts normalized to HBA expression measured by RT-qPCR in BM cells sorted for CD235a. (G) Percentage of HbF-positive cells measured by flow cytometry in BM-derived human CD235a+ cells. (H) HbF and HbA levels measured by CE-HPLC in human CD235a+ BM cells. The percentage of each Hb type was calculated over the total Hb tetramers. All data are expressed as mean ± SD. Each point represents an individual mouse; in the treated group squares indicate samples treated with Tet1 and circles depict samples treated with CBP + Tet1. Asterisks indicate level of statistical significance; *P ≤ .05; no asterisk = not significant (unpaired t-test).

References

    1. Kato GJ, Piel FB, Reid CD et al. Sickle cell disease. Nat Rev Dis Primer. 2018; 4:1–22. - PubMed
    1. Piel FB, Steinberg MH, Rees DC Sickle cell disease. N Engl J Med. 2017; 376:1561–73. 10.1056/NEJMra1510865. - DOI - PubMed
    1. Weatherall DJ Phenotype–genotype relationships in monogenic disease: lessons from the thalassaemias. Nat Rev Genet. 2001; 2:245–55. 10.1038/35066048. - DOI - PubMed
    1. Cappellini MD, Porter JB, Viprakasit V et al. A paradigm shift on beta-thalassaemia treatment: how will we manage this old disease with new therapies?. Blood Rev. 2018; 32:300–11. 10.1016/j.blre.2018.02.001. - DOI - PubMed
    1. Taher AT, Weatherall DJ, Cappellini MD Thalassaemia. Lancet. 2018; 391:155–67. 10.1016/S0140-6736(17)31822-6. - DOI - PubMed