. 2025 Jul 8;53(13):gkaf597.
doi: 10.1093/nar/gkaf597.

Telomeric repeat-containing RNA increases in aged human cells

Affiliations

Telomeric repeat-containing RNA increases in aged human cells

Yu-Hung Hsieh et al. Nucleic Acids Res. .

Abstract

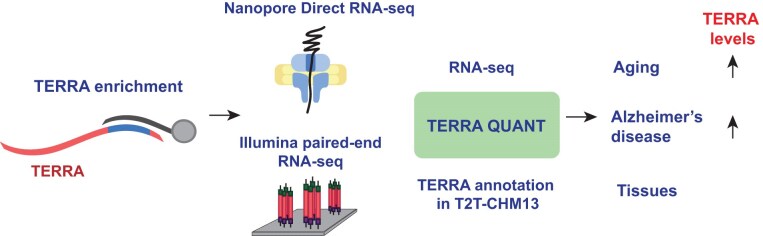
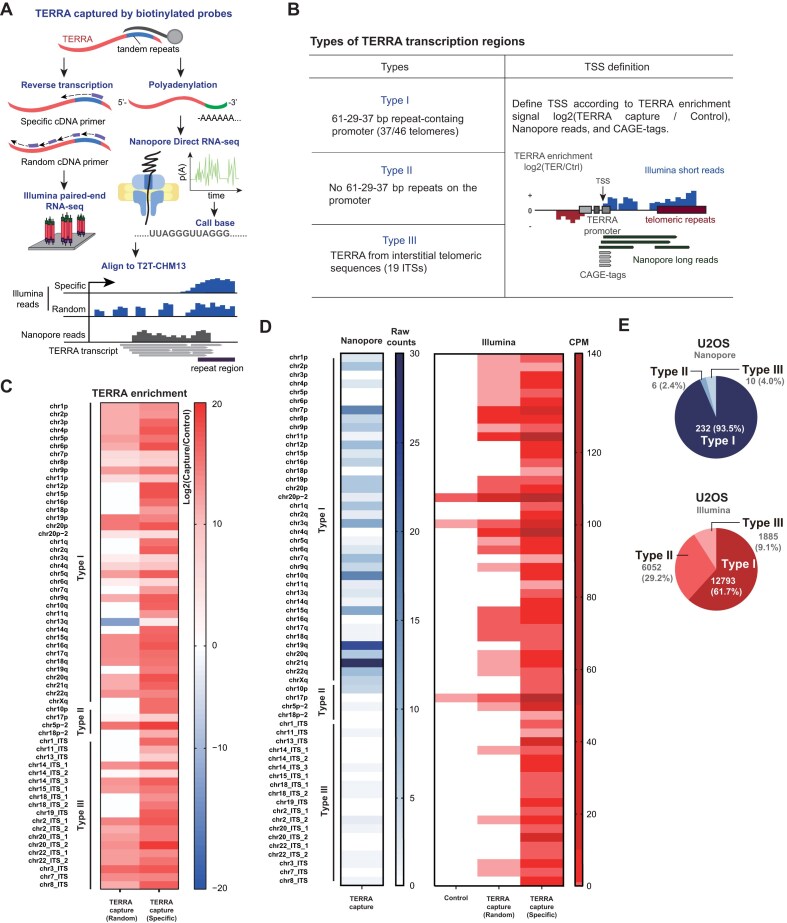
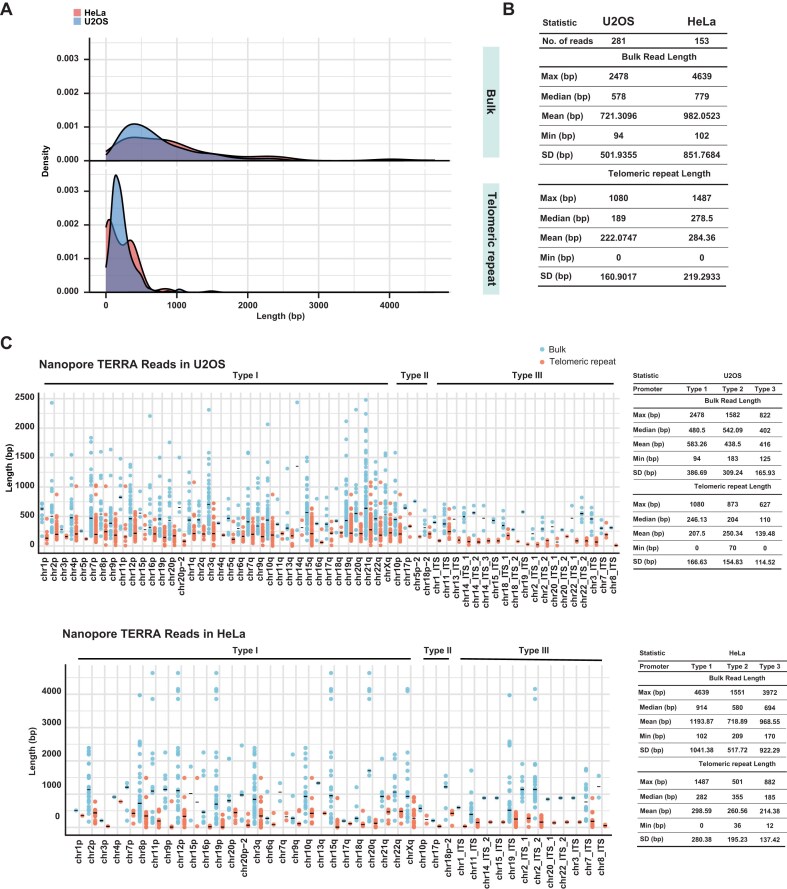
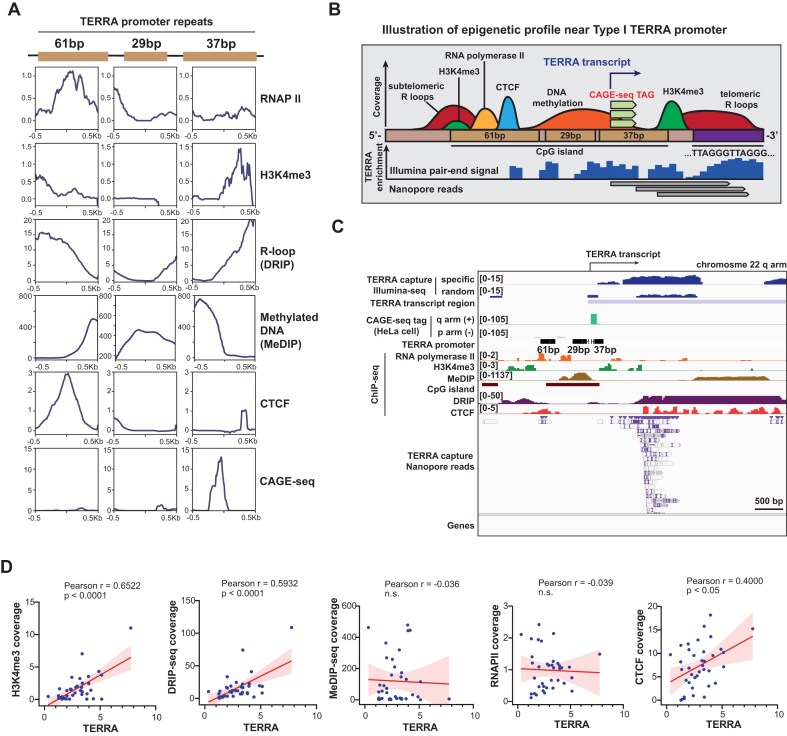
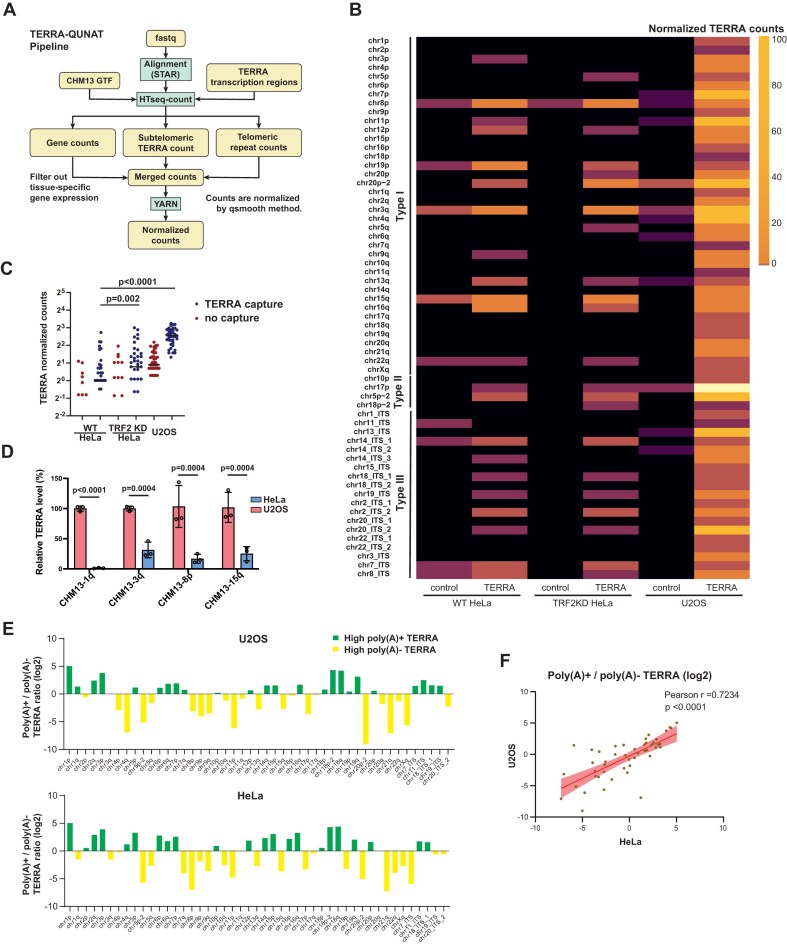
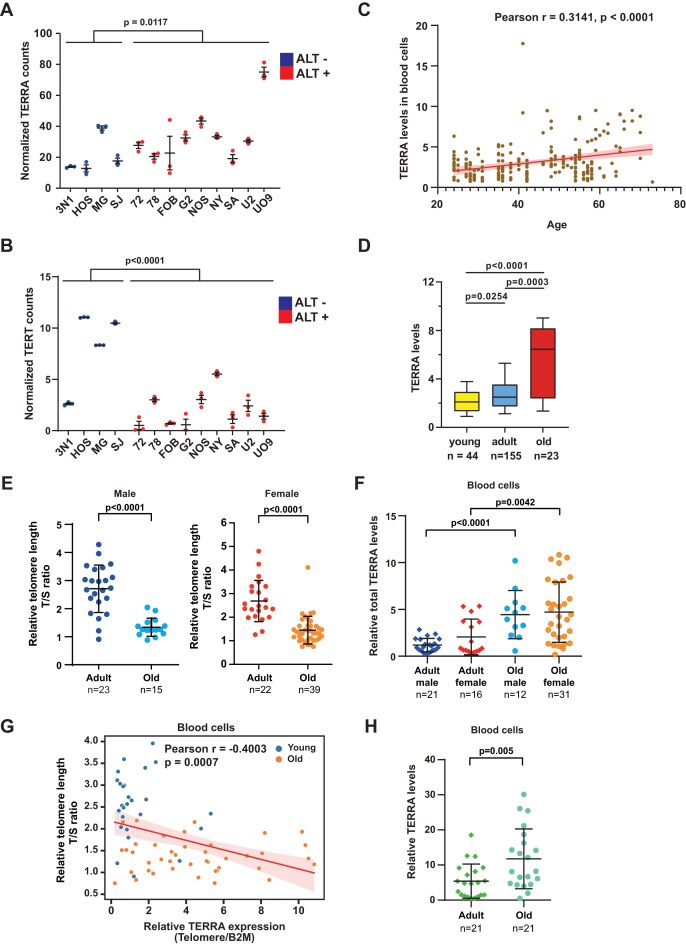
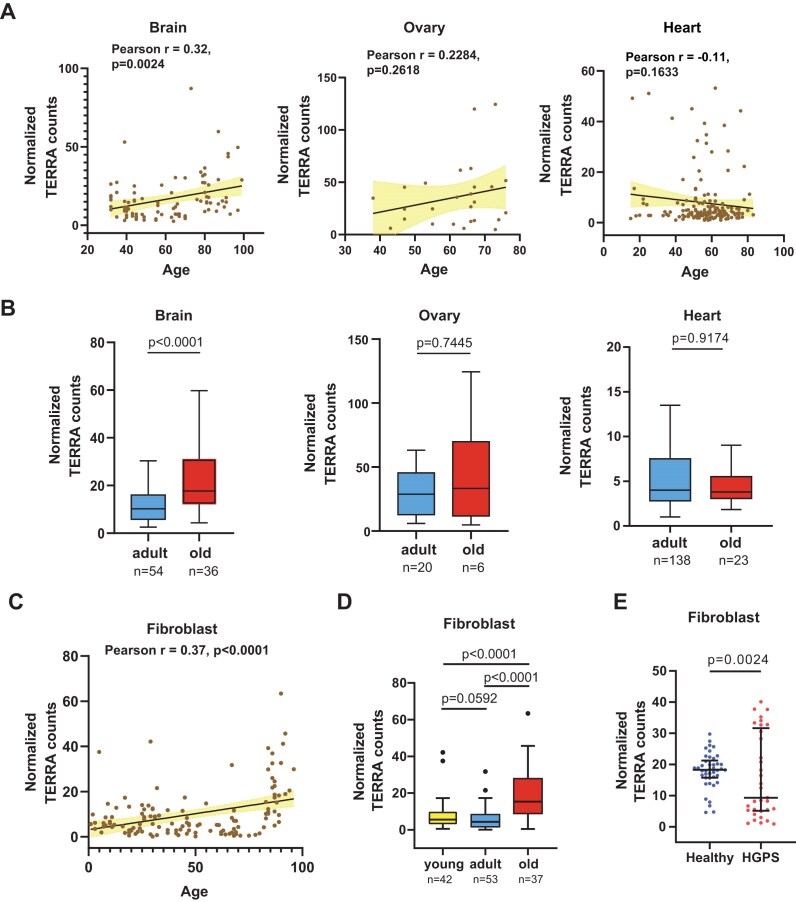
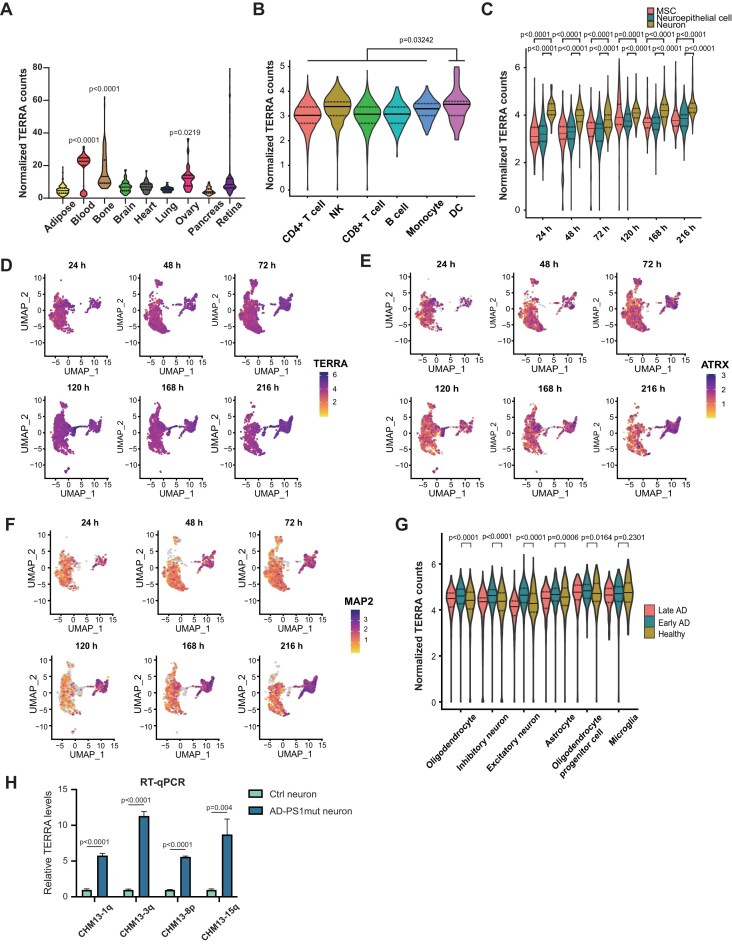
Telomeric repeat-containing RNA (TERRA), transcribed from subtelomeric regions toward telomeric ends, poses challenges in deciphering its complete sequences. Utilizing TERRA-capture RNA-seq and Oxford Nanopore direct RNA sequencing to acquire full-length TERRA, we annotate TERRA transcription regions in the human T2T-CHM13 reference genome. TERRA transcripts encompass hundreds to over a thousand nucleotides of telomeric repeats, predominantly originating from 61-29-37 bp repeat promoters enriched with H3K4me3, RNA Pol II, CTCF, and R-loops. We develop a bioinformatics tool, TERRA-QUANT, for quantifying TERRA using RNA-seq datasets and find that TERRA increases with age in blood, brain, and fibroblasts. TERRA upregulation in aged leukocytes is confirmed by reverse transcription quantitative polymerase chain reaction. Single-cell RNA-seq analysis demonstrates TERRA expression across various cell types, with upregulation observed in neurons during human embryonic stem cell differentiation. Additionally, TERRA levels are elevated in brain cells in the early stage of Alzheimer's disease. Our study provides evidence linking TERRA to human aging and diseases.


Conflict of interest statement

None declared.

Figures

Graphical Abstract
Graphical Abstract
Figure 1.
Figure 1.
Identification of TERRA transcription regions by short-read and long-read RNA-seq in human cells. (A) The flowchart of TERRA-capture RNA-seq. TERRA was captured by using biotinylated antisense oligos. Captured TERRA RNAs were subjected to Illumina or Oxford Nanopore long-read RNA direct sequencing. (B) Definition of three types of TERRA transcription regions. TERRA transcription start sites were determined by TERRA enrichment from Illumina short-reads, Nanopore long reads, and CAGE-seq. (C) Heatmap represents TERRA enrichment (log2 values) at different chromosome ends and interstitial telomeric sequences (ITSs) based on Illumina read counts of TERRA transcripts in U2OS cells. cDNA was synthesized using random or telomeric specific primers for library contruction. Capture: TERRA capture RNA-seq. Control: regular RNA-seq with ribosomal RNA depletion. (D) Heatmap represents TERRA read counts from different chromosome ends and ITSs in U2OS cells. Reads from Illumina or Nanopore sequencing were mapped to T2T-CHM13. CPM: counts per million mapped reads. (E) Pie charts show the numbers of Type I, II, and III TERRA reads from Nanopore or Illumina sequencing in U2OS cells.
Figure 2.
Figure 2.
TERRA length distribution from Nanopore reads in U2OS and HeLa cells. (A) Density plots showing the distribution of TERRA bulk read lengths and telomeric repeat lengths in TERRA reads in U2OS and HeLa cells. Nanopore reads mapped to T2T-CHM13 TERRA transcription regions were calculated. (B) Statistic analysis of TERRA bulk read lengths and telomeric repeat lengths in TERRA reads. (C) Dot plots show TERRA bulk read lengths and telomeric repeat lengths in TERRA reads at each chromosome end and ITS. Each dot represents each Nanopore read. Solid bar, median.
Figure 3.
Figure 3.
Enrichments of H3K4me3, RNA Pol II, CpGs, DNA methylation, and R-loop at TERRA promoters. (A) Meta-analysis showing the distribution of epigenetic marks on 61–29-37 bp repeats located in the subtelomeric regions (Type I promoter). Each plot represents the coverage of indicated marks. (B) A schematic model of the epigenetic profiles at Type I TERRA promoter near telomeres. (C) Genome browser view showing the coverage of indicated epigenetic marks at TERRA promoter on chr22q arm. (D) Scatter plots of TERRA versus H3K4me3, R-loop (DRIP-seq), DNA methylation (MeDIP-seq), CTCF, or RNAPII near TERRA transcription start sites. Each dot indicates TERRA enrichment and epigenetic marks at individual chromosome ends (Type I + Type II TERRA transcription regions) in U2OS cells. TERRA enrichment (log2 ratio) was calculated by comparing TERRA capture and no capture. P-values by Pearson’s correlation.
Figure 4.
Figure 4.
TERRA-QUANT for measuring TERRA expression. (A) The workflow of bioinformatics pipeline for quantification of TERRA expression. Reads that mapped to TERRA transcription regions were counted. YARN was used for normalization between different tissues. (B) Heatmap showing TERRA expression from individual chromosome ends and ITSs in HeLa and U2OS cells. TERRA capture, using antisense oligos to enrich TERRA. Control, no TERRA capture. (C) TERRA normalized counts were analyzed by TERRA-QUANT. Each dot indicates TERRA counts at individual chromosome ends and ITSs. TRF2 deletion (TRF2KO) in HeLa cells increases TERRA expression. P-values by Wilcoxon matched-pair signed rank test. Bars, median. (D) RT-qPCR to detect TERRA in HeLa and U2OS cells. Subtelomeric primers for TERRA were designed based on the T2T-CHM13 genome sequence. Data from three biological replicates. P-values by two-tailed Student’s t-test. Bars, mean ± SD. (E) Log2 ratios of poly(A)+ to poly(A)− TERRA reads mapped to individual chromosome ends and ITSs in U2OS and HeLa cells. (F) Scatter plots showing the correlation between U2OS and HeLa cells in the poly(A)+/poly(A)− TERRA ratios. Each dot represents the ratio (log2) of poly(A)+/poly(A)− reads at each TERRA transcription region.
Figure 5.
Figure 5.
TERRA levels increase with age in blood cells. (A) TERRA expression in ALT-positive (+) or negative (−) cell lines was quantified by TERRA-QUANT. Total TERRA counts at all chromosome ends were accumulated. Each dot indicates the normalized TERRA read counts of each RNA-seq dataset. Bars, mean ± SD. P-values, by Mann–Whitney U test. (B) TERT expression of each RNA-seq data from ALT+ or ALT− cells. Bars, mean ± SD. P -values, by Mann–Whitney Utest. (C) TERRA expression in human blood cells was analyzed by TERRA-QUANT using RNA-seq datasets. Scatter plots showing the correlation of TERRA versus age in blood. Each dot indicates the total TERRA normalized reads from all chromosome ends of each individual. P -values, by Pearson’s correlation. (D) Normalized TERRA counts in blood cells of different ages: young (<30 years); adult (30–59 years); and old (≥60 years). Bars, median with interquartile. P-v-alues, by Mann–WhitneyU test. (E) The T/S ratio represents the relative telomere length (T) to the single-copy gene (S, 36B4 gene). Each dot represents an individual T/S ratio: adult (21–59 years); old (≥60 years). (F) RT-qPCR to detect total TERRA levels in blood cells using telomeric repeat primers. Each dot indicates each individual. (G) Scatter plot showing negative correlation between TERRA and telomere length in blood cells. P -values, by Pearson’s correlation. (H) RT-qPCR to detect TERRA levels using subtelomeric primers (hg38-2q). Each dot indicates each individual. (E, F, and H) P -values, by two-tailed Student’s t-test. n = sample size. Error bar, SD.
Figure 6.
Figure 6.
TERRA expression increases with age in brain tissues and fibroblasts. (A) Scatter plots showing the correlation of TERRA versus age in brain, ovary, and heart tissues. Each dot indicates the total TERRA level from all chromosome ends in an individual. P values, by Pearson’s correlation. (B) TERRA levels in various tissues with different ages: Adult (21–59 years); and old (≥60 years). Bars, median with interquartile. P values, by Mann–Whitney U test. (C) TERRA levels in human fibroblasts derived from healthy individuals of different ages. P values, by Pearson’s correlation. (D) Boxplots showing the upregulation of TERRA levels in old human fibroblasts: Young (<30 years); adult (30–59 years); and old (≥60 years). Bars, median with interquartile. P values, by Mann–Whitney U test. (E) Fibroblasts derived from HGPS patients display abnormal TERRA levels. Each dot represents the TERRA level of each individual. Bars, median with interquartile. P values, by Kolmogorov–Smirnov test.
Figure 7.
Figure 7.
Single-cell analysis of TERRA levels undergoing neuronal differentiation and in Alzheimer’s disease. (A) Violin plot showing normalized TERRA counts in various human tissues. The solid lines indicate the median and the dashed lines are interquartile range. P values, by Mann–Whitney U test. (B) Single-cell RNA-seq showing normalized TERRA counts in various immune cells from PBMC. NK, nature killer cell; DC, dendritic cells. Solid lines, median. Dashed lines are interquartile range. P values, by Mann–Whitney Utest. (C) Single-cell RNA-seq analysis of normalized TERRA counts in hESCs undergoing neuronal differentiation with various HOX patterning periods (24, 72, 48, 120, 168, and 216 h). MSC, mesenchymal stem cells. Solid lines, median. Dashed lines are interquartile range. P values, by Mann–Whitney U test. (DF). UMAP plots of single-cell RNA-seq datasets from hESCs undergoing neuronal differentiation using various HOX patterning periods. Colors according to TERRA, ATRX, or neuron marker MAP2 expression levels. (G) TERRA levels in cells isolated from the prefrontal cortex of individuals with Alzheimer’s disease (AD). Single-nucleus RNA-seq datasets were obtained from the ROSMAP project, and grouped into healthy (no AD pathology), early-AD pathology, and late-AD pathology. Solid lines, median. Dashed lines are interquartile range. P values, by Mann–Whitney U test. (H) RT-qPCR analysis showing elevated TERRA levels in AD neurons. AD-PS1mut or Ctrl neurons were differentiated from iPSC. AD-PS1mut carrying P117L mutation in PS1 gene. Ctrl: mutation-corrected isogenic control. P values, by two-tailed Student’s t-test. n = 3. TERRA levels normalized to GAPDH.

Similar articles

References

    1. Azzalin CM, Reichenbach P, Khoriauli L et al. Telomeric repeat containing RNA and RNA surveillance factors at mammalian chromosome ends. Science. 2007; 318:798–801. 10.1126/science.1147182. - DOI - PubMed
    1. Schoeftner S, Blasco MA Developmentally regulated transcription of mammalian telomeres by DNA-dependent RNA polymerase II. Nat Cell Biol. 2008; 10:228–36. 10.1038/ncb1685. - DOI - PubMed
    1. Feretzaki M, Renck Nunes P, Lingner J Expression and differential regulation of human TERRA at several chromosome ends. RNA. 2019; 25:1470–80. 10.1261/rna.072322.119. - DOI - PMC - PubMed
    1. Nergadze SG, Farnung BO, Wischnewski H et al. CpG-island promoters drive transcription of human telomeres. RNA. 2009; 15:2186–94. 10.1261/rna.1748309. - DOI - PMC - PubMed
    1. Graf M, Bonetti D, Lockhart A et al. Telomere length determines TERRA and R-loop regulation through the cell cycle. Cell. 2017; 170:72–85. 10.1016/j.cell.2017.06.006. - DOI - PubMed