. 2025 Aug 15;85(16):3111-3122.
doi: 10.1158/0008-5472.CAN-25-0073.

AREG and EREG Are Predictive Biomarkers of Response to EGFR Inhibition in Gastroesophageal Cancer

Affiliations

AREG and EREG Are Predictive Biomarkers of Response to EGFR Inhibition in Gastroesophageal Cancer

Daniela Conticelli et al. Cancer Res. .

Abstract

EGFR is a potential therapeutic target in gastroesophageal cancer. However, negative results from several phase II/III clinical trials have hindered the approval of EGFR inhibitors for treating gastroesophageal adenocarcinoma. Preclinical and clinical results have shown that EGFR targeting is effective in patients with gastroesophageal adenocarcinoma harboring EGFR amplification. Retrospective analyses also suggest that a subset of patients with gastroesophageal adenocarcinoma lacking EGFR amplification may benefit from the treatment, thus underscoring the need to identify reliable predictive biomarkers of response. Through the screening of 27 gastroesophageal adenocarcinoma primary cancer cell lines and 10 patient-derived xenograft models, we identified a subset of gastroesophageal adenocarcinoma lacking EGFR quantitative alterations but sensitive to EGFR targeting. Molecular characterization of the sensitive models revealed overexpression of the EGFR ligand amphiregulin (AREG) or epiregulin (EREG). Post hoc analysis of patients on the Cancer Esophagus Gefitinib trial treated with the EGFR inhibitor gefitinib demonstrated a significant correlation between overall survival and AREG/EREG expression level. No predictive power of EGFR ligand expression was observed in the presence of KRAS mutations. In conclusion, this study proposes the existence of a subgroup of patients with gastroesophageal adenocarcinoma with susceptibility to EGFR inhibition driven by overexpression of the EGFR ligands AREG and EREG.

Significance: Elevated levels of AREG or EREG in gastroesophageal cancer confers sensitivity to EGFR inhibition, providing a low-toxicity treatment option for the subpopulation of patients overexpressing the EGFR ligands.


Conflict of interest statement

F. Pietrantonio reports receiving research funding (to institution) from Eli Lilly and Company, Bristol Myers Squibb, Incyte, AstraZeneca, Amgen, Agenus, and Rottapharm Biotech, personal honoraria as an invited speaker from BeiGene, Daiichi Sankyo, Seagen, Astellas, Ipsen, AstraZeneca, Servier, Bayer, Takeda, Johnson & Johnson, Bristol Myers Squibb, MSD, Amgen, Merck Serono, and Pierre Fabre, and advisory/consultancy fees from Bristol Myers Squibb, MSD, Amgen, Pierre Fabre, Johnson & Johnson, Servier, Bayer, Takeda, Astellas, GSK, Daiichi Sankyo, Pfizer, BeiGene, Jazz Pharmaceuticals, Incyte, Rottapharm Biotech, Merck Serono, Italfarmaco, Gilead Sciences, AstraZeneca, and Agenus outside the submitted work. R. Petty reports grants from Chief Scientist Office (Scotland) and Cancer Research UK during the conduct of the study, as well as grants and personal fees from Amgen, AstraZeneca, Servier, and Astellas, personal fees from Bristol Myers Squibb, and grants from BeiGene, Platinum Discovery, MSD, Moderna, BioNTech, Daiichi Sankyo, and Roche outside the submitted work. No disclosures were reported by the other authors.

Figures

Figure 1.
Figure 1.
Workflow of the experimental plan. Collection of gastroesophageal adenocarcinoma (GEA) samples, subcutaneous implant in non-immunocompetent mice, generation of in vitro material, evaluation of in vitro response to EGFR-targeted drugs, and in vivo validation. Created in BioRender. Corso, S. (2025) https://BioRender.com/ejv17qx.
Figure 2.
Figure 2.
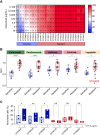
A subset of gastroesophageal tumors not displaying EGFR gene amplification is sensitive to anti-EGFR drugs. A, Heatmap showing the viability (in percentage vs. untreated) of 27 primary cell lines treated for 6 days with the indicated doses of the mAb cetuximab. The heatmap represents the average of three independent experiments. B, Boxplot showing the sensitivity of the 27 primary cells (divided into resistant and sensitive groups on the basis of the response to cetuximab) to the indicated drugs. Each dot represents the mean AUC computed by the mean of three independent experiments. Statistical significance was calculated using the Student t test. The labeled dot indicates a HER2-amplified cell line (GTR0233). C, Boxplots showing the percentage of nonviable cells (positive for trypan blue staining), untreated (−) cells, or cells treated (+) with cetuximab (CTX; 5 µg/mL for 6 days). The average of four independent experiments performed on three cetuximab-sensitive (GTR0539, GTR0640, and GTR0247) and three cetuximab-resistant cell lines (GTR0125, GTR0498, and GTR0687) is shown. Statistical significance was calculated using the ratio paired t test. *, P < 0.05; **, P < 0.01; ****, P < 0.0001.
Figure 3.
Figure 3.
Preclinical trials confirm the sensitivity of a subset of gastroesophageal adenocarcinoma PDXs to cetuximab. Tumor growth curves of the PDX cohorts derived from five responsive and five resistant models according to in vitro data. After reaching an average tumor volume of 220 to 250 mm3, PDXs were randomized and treated with either placebo (vehicle; pale blue or pale red lines) or cetuximab (20 mg/kg, twice weekly i.p.; dark blue or dark red lines). Lines represent average tumor volume + SD. N = 5–7 animals/group. The response was evaluated using RECIST 1.1–like criteria: progressive disease (PD), ≥35% increase from baseline; partial response (PR), ≥50% reduction from baseline; stable disease (SD), intermediate variations from baseline. The clinical response of each PDX cohort is indicated. Arrow, treatment start. Statistical significance was calculated using the two-way ANOVA with Bonferroni correction. At the end of the trial (GTR0187 and GTR0247) or at the time of mice sacrifice (GTR0539, GTR0558, and GTR0640), the cetuximab arm was compared with the vehicle arm. ****, P < 0.0001. CR, complete response.
Figure 4.
Figure 4.
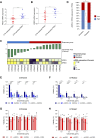
Cetuximab-sensitive tumors overexpress the EGFR ligand AREG or EREG and rely on its expression for viability. A and B, Dot plots depicting AREG and EREG mRNA expression levels in cetuximab-resistant vs. cetuximab-sensitive PDX models. Statistical significance was calculated using the unpaired t test. CTX, cetuximab. C, Heatmap representing AREG and EREG relative mRNA expression in cetuximab-resistant and -sensitive PDX models. D, Stacked barplot showing dichotomized analysis of cetuximab-response groups in PDX models according to AREG/EREG expression. Low, both ligands in Q1–Q3; high, at least one ligand in Q4. Statistical significance was calculated using the χ2 test. E–H,AREG and EREG expression was silenced in cetuximab-sensitive [GTR0539 (E) and GTR0640 (F)] and -resistant [GTR0498 (G) and GTR0687 (H)] cells. Silenced and control cells were treated with the indicated doses of cetuximab for 6 days and viability tested. The barplots show the average of three independent experiments. Statistical significance was calculated using the two-way ANOVA with Tukey correction. *, P < 0.05; **, P < 0.01; ***, P < 0.001; ****, P < 0.0001.
Figure 5.
Figure 5.
Cetuximab-sensitive tumors overexpress HER3 protein and are responsive to HER3 targeting. A, Western blot analysis of HER3 expression in 18 primary gastroesophageal adenocarcinoma cell lines. Vinculin was used as the loading control. Blue cell lines, sensitive cells; red cell lines, resistant cells. B, Boxplot showing the quantification of the intensity of HER3 signal normalized to vinculin in cetuximab-sensitive versus cetuximab-resistant cells. Statistical significance was calculated using the Student t test. C and D, Barplots showing the viability of cetuximab-sensitive/HER3 overexpressing cells (GTR0539 and GTR0640; C) and cetuximab-resistant/HER3 low-expressing cells (GTR0498, GTR0125, and GTR0687; D) treated with 10 µg/mL and 20 µg/mL of the anti-HER3 patritumab deruxtecan (U3-1402) for 6 days. The barplots show the average of three independent experiments. Statistical significance was calculated using the two-way ANOVA with Dunnett correction. E and F, Barplots showing the viability of cetuximab-sensitive cells treated with cetuximab (CTX), U3-1402 (U3), or their combination (CTX + U3) for 6 days. Drugs were used at concentrations near their IC50 values: 1.25 µg/mL CTX and 10 µg/mL for GTR0539 and 2.5 µg/mL and 20 µg/mL for GTR0640. The barplots show the average of three independent experiments. Statistical significance was calculated using the one-way ANOVA with Tukey correction. NT, not treated. *, P < 0.05; **, P < 0.01; ***, P < 0.001; ****, P < 0.0001.
Figure 6.
Figure 6.
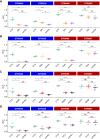
Cetuximab treatment does not impair the efficacy of chemotherapeutic treatments in cetuximab-sensitive cells. Dotplots showing the AUC of GTR0539 and GTR0640 (sensitive) and GTR0498 and GTR0687 (resistant) cells treated with epirubicin (EPI; A), oxaliplatin (OXA; B), SN38 (C), and 5-FU (D), alone or in combination (combo) with cetuximab (CTX). Three independent experiments were performed. The horizontal line represents the mean value of the three experiments. Statistical significance was calculated using the one-way ANOVA with Tukey correction. ns, nonsignificant; *, P < 0.05; **, P < 0.01; ***, P < 0.001; ****, P < 0.0001.
Figure 7.
Figure 7.
Overexpression of either AREG or EREG identifies patients responsive to EGFR targeting. A, Retrospective analysis of the clinical response to gefitinib of COG patients. Response was dichotomized for disease control or progressive disease. B,AREG and EREG expression was quantified by RNA ISH in 67 tumor samples from gefitinib-treated patients enrolled in the COG clinical trial. The expression of the ligands was divided into quartiles. Low, Q1–Q3; high, at least one ligand in Q4. Kaplan–Meier curves showing the OS probability in patients with either low or high ligand expression. Statistical evaluation was performed with the log-rank (Mantel–Cox) test. C, Stacked barplot showing dichotomized analysis of disease control in COG patients according to AREG/EREG expression. Low, both ligands in Q1–Q3; high, at least one ligand in Q4. Statistical significance was calculated using the χ2 test. *, P < 0.05. D, Forest plot of multivariate analyses performed using the Cox proportional hazards model. BMI, body mass index; mut, mutant; WHO, World Health Organization; wt, wild type.

References

    1. Janjigian YY, Kawazoe A, Yañez P, Li N, Lonardi S, Kolesnik O, et al. The KEYNOTE-811 trial of dual PD-1 and HER2 blockade in HER2-positive gastric cancer. Nature 2021;600:727–30. - PMC - PubMed
    1. Janjigian YY, Shitara K, Moehler M, Garrido M, Salman P, Shen L, et al. First-line nivolumab plus chemotherapy versus chemotherapy alone for advanced gastric, gastro-oesophageal junction, and oesophageal adenocarcinoma (CheckMate 649): a randomised, open-label, phase 3 trial. Lancet 2021;398:27–40. - PMC - PubMed
    1. Nevo Y, Ferri L. Current management of gastric adenocarcinoma: a narrative review. J Gastrointest Oncol 2023;14:1933–48. - PMC - PubMed
    1. Birkman EM, Ålgars A, Lintunen M, Ristamäki R, Sundström J, Carpén O. EGFR gene amplification is relatively common and associates with outcome in intestinal adenocarcinoma of the stomach, gastro-oesophageal junction and distal oesophagus. BMC Cancer 2016;16:406. - PMC - PubMed
    1. Xie YH, Chen YX, Fang JY. Comprehensive review of targeted therapy for colorectal cancer. Signal Transduct Target Ther 2020;5:22. - PMC - PubMed

MeSH terms