. 2025 Jul 10:12:RP91236.
doi: 10.7554/eLife.91236.

The magnitude and time course of pre-saccadic foveal prediction depend on the conspicuity of the saccade target

Affiliations

The magnitude and time course of pre-saccadic foveal prediction depend on the conspicuity of the saccade target

Lisa M Kroell et al. Elife. .

Abstract

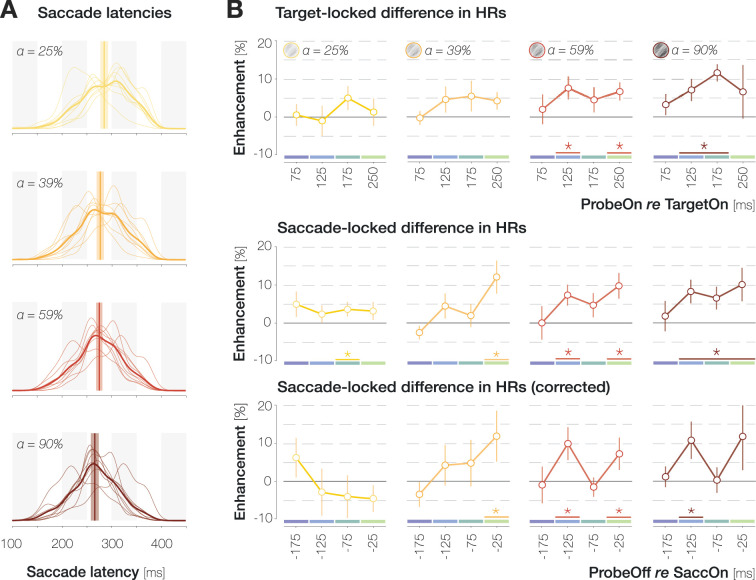
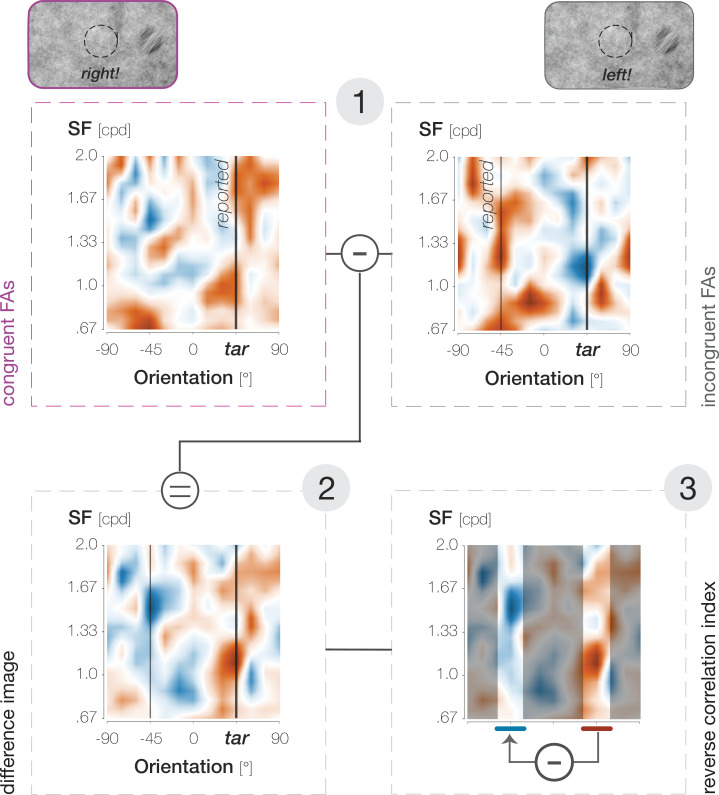
We previously demonstrated that during the preparation of a saccadic eye movement, human observers anticipate defining features of the eye movement target in pre-saccadic foveal vision (Kroell and Rolfs, 2022). In this Research Advance, we show that the conspicuity of feature information at the saccade target location influences the magnitude and time course of foveal enhancement. Observers prepared a saccade to a peripheral orientation signal (the target) while monitoring the appearance of another orientation signal (the probe) in their pre-saccadic center of gaze. The foveal probe appeared in 50% of trials and either had the same orientation as the target (congruent) or a different orientation (incongruent). Crucially, we manipulated the opacity of the target against the 1/f noise background in four logarithmic steps (25-90%). An increase in opacity translated to an increase in luminance contrast and signal-to-noise ratio of orientation information within the target region. Foveal enhancement defined as the difference between hit rates to target-congruent and target-incongruent foveal probes increased with target opacity. Moreover, the time course of foveal enhancement showed an oscillatory pattern that was particularly pronounced at high target opacities. Reverse correlations furthermore suggest that at higher target opacities, false alarms were increasingly triggered by signal, i.e., by incidental orientation information in the foveal noise. Beyond providing new mechanistic insights, these findings are relevant for researchers planning to adapt our paradigm to study related questions. Presenting the saccade target at a high signal-to-noise ratio appears beneficial, as foveal congruency effects, especially when time-resolved, are most robustly detectable.

Keywords: active vision; foveal vision; human; neuroscience; psychophysics; saccadic eye movements.


Conflict of interest statement

LK, MR No competing interests declared

Figures

Figure 1.
Figure 1.. Summary of the paradigm.
(A) Example trial procedure: the saccade target and foveal probe were embedded in full-screen noise images flickering at a frequency of 20 Hz (image duration of 50 ms). After 200 ms, the saccade target (an orientation-filtered patch; filtered to either –45° or +45°; 3 degrees of visual angle [dva] in diameter) appeared 10 dva to the left or the right of the screen center, cueing the eye movement. On 50% of trials, a probe (a second orientation-filtered patch; filtered to either –45° or +45°) appeared in the screen center at an early (top panel; highlighted element with dark blue outline), medium (light blue outline), or late (green outline) stage of saccade preparation. The foveal probe was presented for 50 ms and could be oriented either congruently or incongruently to the target. In contrast to our previous investigation, the saccade target was presented at one of four opacities (from 25% to 90%; in different blocks). (B) An increase in target opacity translates to an increase in signal-to-noise ratio (SNR; left panel). Within a single trial, the increase in SNR at the target location manifests from the fourth noise image on (i.e. after the target appears; right panel; error bands correspond to the standard deviation across all images). (C) Probe and target timing. Probe timing (left panel): histogram of time intervals between probe offset and saccade onset. Bar heights and error bars indicate the mean and standard error of the mean (SEM; n=9) across observers, respectively. On included trials, the probe appeared after target onset and therefore during saccade preparation (‘sac prep’). Trials in which the probe disappeared more than 250 ms before saccade onset (light gray), during the saccade (yellow) or after saccade offset (orange) were excluded. The yellow background rectangle illustrates the median saccade duration. Target timing (right panel): histogram of time intervals between target offset and saccade offset. Bar heights and error bars indicate the mean and SEM (n=9) across observers, respectively. Unlike in the previous study, we removed the target upon saccade initiation on all trials.
Figure 2.
Figure 2.. Influence of target opacity on hit rates (HRs) and false alarm rates (FARs) across all time points.
(A) Influence of target opacity on congruent and incongruent HRs (purple and gray data points in the left panel), as well as their difference (orange data points, middle panel). Lines and error bands correspond to the fitted linear regression lines ± 2 standard errors of the mean (SEM). The slopes of the fitted regression line per observer (small circles) and their mean and SEM (big circle and error bar) are plotted in the right panel. Asterisks denote statistically significant comparisons (p<0.05; determined via bootstrapping; n=9 observers). (B) Influence of target opacity on congruent and incongruent FARs (left panel), as well as their difference (middle and right panels). All conventions are as in A. (C) Mean difference in filter energies around the target and non-target orientation for the lower two target opacities (left column) and the higher two target opacities (right panel). Lines connect the values of individual observers (small circles) in both conditions. Large circles and error bars denote the mean and SEM, respectively. (D) Pearson correlation between the normalized slope in HRs (A, right panel) and the normalized slope in FARs (B, right panel). Circles indicate individual observers.
Figure 3.
Figure 3.. Time course of enhancement in hit rates (HRs) for different target opacity levels.
(A) Probability density distributions of saccade latencies for increasing target opacity. Distributions with thin and thick lines represent individual-observer and mean probability densities, respectively. Vertical lines and shaded regions represent median latencies and standard errors of the mean (SEMs), respectively. (B) Target- (first row) and saccade- (second and third row) locked time course of enhancement. To obtain the corrected saccade-locked time course, the proportion of different target-locked bins in each saccade-locked bin was equalized across opacities to account for the systematic decrease in latencies with increasing opacity (see A). X-axis values indicate the center of 50 ms bins. Note that for saccade-locked time courses, the last bin contains probe onset times between 200 and 300 ms to allow for sufficient trial numbers. Across panels, error bars indicate SEMs. Asterisks denote significant differences between congruent and incongruent HRs (p≤0.05; determined via bootstrapping with 10,000 repetitions; n=9 observers).
Figure 4.
Figure 4.. Continuous time course of foveal congruency effects.
First row: continuous time course of enhancement in hit rates (HRs) (HRcong–HRincong) across target opacities (gray; plot 1) and separately for different target opacity levels (plots 2–5; yellow to dark red). X-axis values indicate the latest time point in a sliding boxcar window of 50 ms duration. Data points and error bars correspond to the mean ± 1 standard error of the mean (SEM) across observers. Lines and error bands correspond to mean sixth-order polynomial fits ±1 SEM. Horizontal lines above the x-axes denote significant enhancement (p≤0.05; determined via bootstrapping with 10,000 repetitions; n=9 observers). Second row: same plots as in the first row but separately for congruent (purple) and incongruent (gray) HRs.
Figure 5.
Figure 5.. Hit rates (HRs) and false alarm rates (FARs) separately for short-latency (A) and long-latency (B) saccades.
All conventions are as in Figure 2.
Figure 6.
Figure 6.. Saccade target properties at different opacity levels.
Variation of root mean square (RMS) contrast (first column), Michelson contrast (second column), and signal-to-noise ratio (SNR) (third column) within the saccade target region. (A) Probability density distributions per measure and target opacity (yellow to dark red shadings). (B) Mean and standard deviation of contrast and SNR separately for each noise image presented during the saccade preparation period. The target was presented from the fourth noise image on.
Figure 7.
Figure 7.. Calculation of the reverse correlation index plotted in Figure 2C, illustrated for the 59% target opacity condition.
In step 1, we identified the average properties (SF*orientation) of the foveal noise window on congruent (purple outlines and font) and incongruent (gray outlines and font) FA trials. In step 2, we determined the difference between them (congruent-incongruent). In step 3, we subtracted filter energies around the non-target orientation (–45°) from filter energies around the target orientation (45°).
Appendix 1—figure 1.
Appendix 1—figure 1.. The influence of target opacity on saccade metrics.
(A) Probability density distributions of saccade latencies for different, increasing target opacities (from top to bottom; see Figure 3A). Distributions with thin and thick lines represent individual-observer and mean probability densities, respectively. Vertical lines and shaded regions represent median latencies and standard errors. (B) Bivariate Gaussian kernel densities of saccade landing coordinates separately for leftward and rightward saccades. The distance between the fixation and target locations was reduced for illustration purposes (see legend). (C) Main sequences defined as the relation between saccade amplitudes and peak velocities. Dots symbolize individual trials (n~29,000). Fitted lines represent the average of logistic function fits to individual-observer data (Conder, 2023). The mean parameters of each fit are provided above the respective panel (‘tHalf’: symmetric inflection point; ‘qInf’: horizontal asymptote; α: decay constant). (D) Summary plots for saccade latency, amplitude, landing error, and peak velocity. Dots represent median (latency) and mean (amplitude, error, velocity) values across observers, and error bars represent the respective standard errors. Black lines and shaded error bands represent the mean of linear fits to individual-observer data and their standard errors, respectively. Asterisks highlight slopes that are significantly different from zero (determined via bootstrapping, n=9 observers, p<0.05).
Author response image 1.

Update of

  • doi: 10.1101/2023.07.06.548056
  • doi: 10.7554/eLife.91236.1
  • doi: 10.7554/eLife.91236.2
  • doi: 10.7554/eLife.91236.3

Similar articles

References

    1. Albrecht DG. Visual cortex neurons in monkey and cat: effect of contrast on the spatial and temporal phase transfer functions. Visual Neuroscience. 1995;12:1191–1210. doi: 10.1017/s0952523800006817. - DOI - PubMed
    1. Albrecht DG, Geisler WS, Frazor RA, Crane AM. Visual cortex neurons of monkeys and cats: temporal dynamics of the contrast response function. Journal of Neurophysiology. 2002;88:888–913. doi: 10.1152/jn.2002.88.2.888. - DOI - PubMed
    1. Bastos AM, Vezoli J, Bosman CA, Schoffelen JM, Oostenveld R, Dowdall JR, De Weerd P, Kennedy H, Fries P. Visual areas exert feedforward and feedback influences through distinct frequency channels. Neuron. 2015;85:390–401. doi: 10.1016/j.neuron.2014.12.018. - DOI - PubMed
    1. Benedetto A, Morrone MC. Saccadic suppression is embedded within extended oscillatory modulation of sensitivity. The Journal of Neuroscience. 2017;37:3661–3670. doi: 10.1523/JNEUROSCI.2390-16.2016. - DOI - PMC - PubMed
    1. Benedetto A, Morrone MC, Tomassini A. The common rhythm of action and perception. Journal of Cognitive Neuroscience. 2020;32:187–200. doi: 10.1162/jocn_a_01436. - DOI - PMC - PubMed

LinkOut - more resources