. 2025 Jul 10;272(8):501.
doi: 10.1007/s00415-025-13232-8.

Evaluating finger-prick blood collection for remote quantification of neurofilament light in neurological diseases

Affiliations

Evaluating finger-prick blood collection for remote quantification of neurofilament light in neurological diseases

Annabelle Coleman et al. J Neurol. .

Abstract

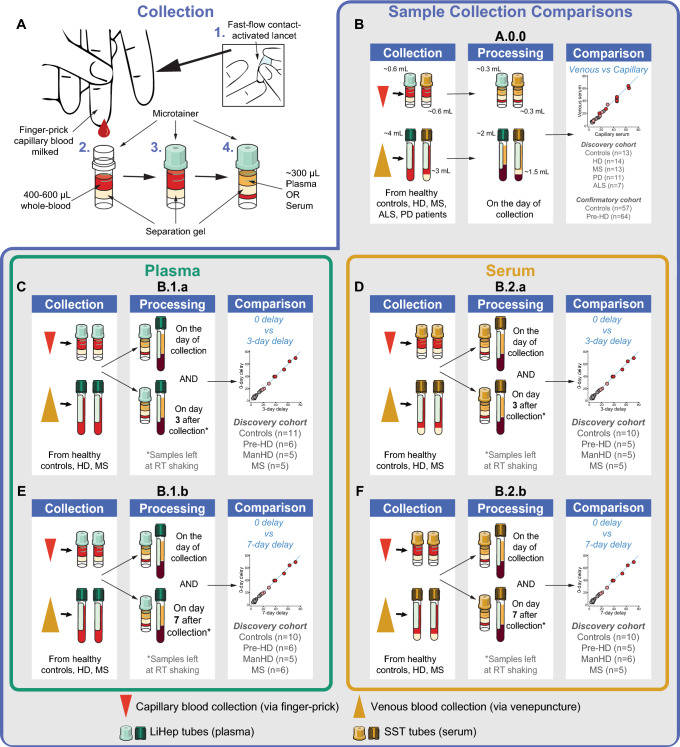
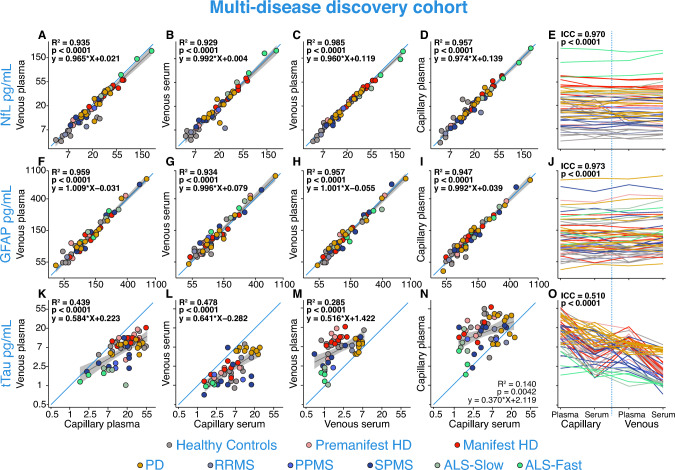
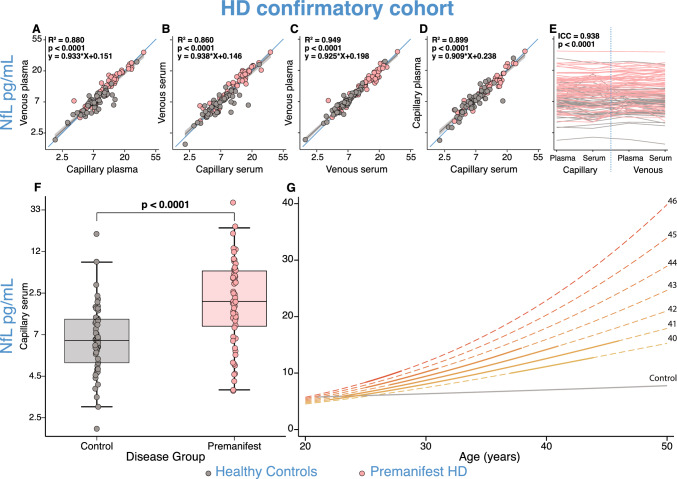
Promising blood-based biomarkers of neuropathology have emerged with potential for therapeutic development and disease monitoring. However, these tools will require specialist tertiary services for integration into clinical management. Remote sampling for biomarker assessment could reduce burden of in-person clinical visits for such tests as well as increasing the sampling frequency and patient geographical outreach. Here, we evaluated a finger-prick blood collection approach for remote quantification of neurofilament light (NfL), a candidate blood-based biomarker evident in various neurological disorders, and other exploratory markers of neuronal injury and neuroinflammation (GFAP, tau). Matched samples from venepuncture and finger-prick were collected and processed into plasma and/or serum to directly compare analyte levels from a multi-disease discovery cohort (n = 54 healthy controls; n = 57 Huntington's disease (HD); n = 34 multiple sclerosis; n = 7 amyotrophic lateral sclerosis; n = 11 Parkinson's disease), and a HD confirmatory cohort (n = 57 healthy controls; n = 64 HD). Two delayed processing conditions were compared, three- and seven-day delay, simulating ambient shipment. Capillary NfL and GFAP concentrations were equivalent to those in venous serum and plasma in the multi-disease discovery cohort and HD confirmatory cohort. Only NfL remained stable after a seven-day processing delay in both venous and capillary serum samples. Using NfL concentrations from capillary blood, we replicated previously published disease group differences measured in venous blood. This data supports our finger-prick approach for remote collection and quantification of NfL. With the widespread applications for NfL across the spectrum of neurological disorders, this has the potential to transform disease monitoring, prognosis, and therapeutic development within clinical practice and research.

Keywords: Biomarkers; Blood; Finger-prick; Neurodegenerative disorders; Neurofilament light; Remote sampling.


Conflict of interest statement

Declarations. Conflicts of interest: LMB holds consultancy contracts with Annexon Biosciences, Remix Therapeutics, PTC Therapeutics, Alchemab Therapeutics, Latus Bio, and LoQus23 Therapeutics Ltd via UCL Consultants Ltd. HZ has served at scientific advisory boards and/or as a consultant for Abbvie, Acumen, Alector, Alzinova, ALZPath, Annexon, Apellis, Artery Therapeutics, AZTherapies, Cognito Therapeutics, CogRx, Denali, Eisai, Merry Life, Nervgen, Novo Nordisk, Optoceutics, Passage Bio, Pinteon Therapeutics, Prothena, Red Abbey Labs, reMYND, Roche, Samumed, Siemens Healthineers, Triplet Therapeutics, and Wave, has given lectures in symposia sponsored by Alzecure, Biogen, Cellectricon, Fujirebio, Lilly, and Roche, and is a co-founder of Brain Biomarker Solutions in Gothenburg AB (BBS), which is a part of the GU Ventures Incubator Program (outside submitted work). AN received consultancy fees during the design phase of AccessPD and reports consultancy and personal fees from AstraZeneca, AbbVie, Profile, Roche, Biogen, UCB, Bial, Charco Neurotech, Alchemab, Sosei Heptares and Britannia, outside the submitted work. AN is an Associate Editor for the Journal of Parkinson’s Disease. In the last 3 years, JC has received support from the Health Technology Assessment (HTA) Programme (National Institute for Health Research, NIHR), the UK MS Society, the US National MS Society and the Rosetrees Trust. He is supported in part by the NIHR University College London Hospitals (UCLH) Biomedical Research Centre, London, UK. He has been a local principal investigator for a trial in MS funded by MS Canada. A local principal investigator for commercial trials funded by: Ionis and Roche; and has taken part in advisory boards/consultancy for Biogen, Contineum Therapeutics, Lucid, Merck, NervGen, Novartis and Roche. SJT reports that over the past 3 years consultancy fees for advisory services were paid to University College London Consultants, a wholly-owned subsidiary of University College London from the following companies: Alchemab, Alnylam Pharmaceuticals, Annexon Bioscience, Arrowhead, Atalanta Therapeutics, Biogen, Catapult, Design Therapeutics, F. Hoffman-La Roche, Ipsen, Iris Medicine, Latus Bio, LifeEdit, Novartis Pharma, Pfizer, Prilenia, Prime Global, PTC Therapeutics, Remix, Rgenta Therapeutics, SkyHawk, Takeda Pharmaceuticals, Triplet Therapeutics, UniQure Biopharma, Vertex Pharmaceuticals, Vico Therapeutics, Wave Life Sciences. SJT has also consulted for Abingworth, Ascidian Therapeutics, EQT, Cure Ventures, FunctionRX, Harrisson & Star, and IQVIA through the office of Celtic Phenomenon. In the past 3 years, University College London Hospitals NHS Foundation Trust, Professor Tabrizi’s host clinical institution, received funding to run clinical trials for Alnylam Pharmaceuticals, F. Hoffman-La Roche, Novartis Pharma, PTC Therapeutics, and UniQure Biopharma. Ethical approval: This study complies with the Declaration of Helsinki and was approved by local ethics committees including The National Hospital for Neurology and Neurosurgery and the Institute of Neurology Joint Research Ethics Committee (HD and controls; ref: 03/N008); London—City & East Research Ethics committee (ALS, MS; ref: 09/H0703/27); South West – Central Bristol Research Ethics Committee (PD: PR 18/SW/0255). Consent to participate: All participants within the study gave written informed consent before blood collection.

Figures

Fig. 1
Fig. 1
Study design and experimental objectives. A Schematic showing capillary sample collection method: 1. Finger-prick performed using a fast-flow lancet, 2. Blood milked from finger, 3. Up to 600 µL whole blood collected into two LiHep and/or SST microtainers, 4. ~ 300 µL capillary plasma/serum generated after processing per microtainer. B Experimental objective A.0.0: matched capillary (microtainer) and venous (vacutainer) samples were collected in serum and plasma tubes and processed on the day of collection to compare analytes between collection methods (finger-prick/venepuncture) and sample types (plasma/serum) in both the multi-disease discovery cohort and HD confirmatory cohort. C Experimental objective B.1.a: assessing the impact of 3-day processing delay in plasma. D Experimental objective B.2.a: assessing the impact of 3-day processing delay in serum. E Experimental objective B.1.b: assessing the impact of 7-day processing delay in plasma. F Experimental objective B.2.b: assessing the impact of 7-day processing delay in serum. For delayed processing experiments, CF two tubes were collected from both finger-prick and venepuncture for either plasma or serum and one tube of each collection type was processed on day zero and the other on the respective processing delay day after shaking at room temperature. Green tubes indicate plasma and yellow tubes indicate serum. ALS amyotrophic lateral sclerosis; HD Huntington’s disease; MS multiple sclerosis; PD Parkinson’s disease; Pre-HD premanifest HD; RT room temperature
Fig. 2
Fig. 2
A.0.0: Analyte concentrations in venous versus capillary and plasma versus serum. Analyte concentrations across different collection methods and sample types from experiment A.0.0 for NfL (AE), GFAP (FJ), and tTau (KO) in healthy controls, pre-HD, manifest-HD, PD, RRMS, PPMS, SPMS, ALS-slow, ALS-fast. Blue lines represent the line of equality (y = x). Grey lines represent the linear regression fit of the data with 95% confidence interval shaded regions. R2 and p values were generated from regression models comparing the two collection types in each panel. The Bonferroni threshold for this experiment was 0.0025 (20 comparisons) and all statistics which reached significance below this are highlighted in bold. NfL, GFAP, and tTau concentrations were natural log-transformed. ALS amyotrophic lateral sclerosis; GFAP glial fibrillary acidic protein; Haem haemoglobin; HD Huntington’s disease; NfL neurofilament light; PD Parkinson’s disease; PPMS primary progressive multiple sclerosis; RRMS relapsing–remitting multiple sclerosis; SPMS secondary progressive multiple sclerosis; tTau total tau
Fig. 3
Fig. 3
B.2.a: Analyte concentrations in venous/capillary serum with and without 3-day delay in processing. Analyte concentrations in serum after zero-day and three-day delay in processing from experiment B.2.a. in the multi-disease discovery cohort for total protein (AE), haemoglobin (FJ), NfL (KO), GFAP (PT), and tTau (UY) from venous and capillary serum in healthy controls, pre-HD, manifest-HD, PPMS, SPMS. Blue lines represent the line of equality (y = x). Grey lines represent the linear regression fit of the data with 95% confidence interval shaded regions. R2 and p values were generated from regression models comparing the impact of delayed processing in each panel. The Bonferroni threshold for this experiment was 0.005 (10 comparisons) and all statistics which reached significance below this are highlighted in bold. NfL and tTau concentrations were natural log-transformed. GFAP glial fibrillary acidic protein; Haem haemoglobin; HD Huntington’s disease; NfL neurofilament light; PPMS primary progressive multiple sclerosis; SPMS secondary progressive multiple sclerosis; tTau total tau
Fig. 4
Fig. 4
B.2.b: Analyte concentrations in venous/capillary serum with and without 7-day delay in processing. Analyte concentrations in serum after zero-day and seven-day delay in processing from experiment B.2.b for total protein (AE), haemoglobin (FJ), NfL (KO), GFAP (PT), and tTau (UY) from venous and capillary serum in healthy controls, pre-HD, manifest-HD, and SPMS. Blue lines represent the line of equality (y = x). Grey lines represent the linear regression fit of the data, with 95% confidence interval shaded regions. R2 and p values were generated from regression models comparing the impact of delayed processing in each panel. The Bonferroni threshold for this experiment was 0.005 (10 comparisons) and all statistics which reached significance below this are highlighted in bold. NfL and tTau concentrations were natural log-transformed. GFAP glial fibrillary acidic protein; Haem haemoglobin; HD Huntington’s disease; NfL neurofilament light; SPMS secondary progressive multiple sclerosis; tTau total tau
Fig. 5
Fig. 5
NfL group comparisons for all day-zero samples in the multi-disease discovery cohort. Disease group comparison of NfL concentrations in the multi-disease discovery cohort from A venous plasma, B venous serum, C capillary plasma, and D capillary serum from all baseline data for healthy controls, PPMS, RRMS, SPMS, PD, Pre-HD, manifest-HD, ALS-slow and ALS-fast patients. p values were generated from multiple linear regressions. The Bonferroni threshold for this experiment was 0.0025 (20 comparisons), and all statistics which reached significance below this are highlighted in bold. NfL values are natural log-transformed. ALS amyotrophic lateral sclerosis; HD Huntington’s disease; Man manifest; MS multiple sclerosis; NfL neurofilament light; PD Parkinson’s disease; PP primary progressive; Pre premanifest; RR relapsing–remitting; SP secondary progressive
Fig. 6
Fig. 6
Replicating NfL consistency and disease phenotype across sample type in HD confirmatory cohort. NfL analyte concentrations across different collection methods and sample types from the HD confirmatory cohort (AE) in healthy controls and pre-HD individuals. Blue lines represent the line of equality (y = x). Grey lines represent the linear regression fit of the data, with 95% confidence interval shaded regions. R2 and p-values were generated from regression models comparing the two collection types in each panel. The Bonferroni threshold for this experiment was 0.0125 (4 comparisons) and all statistics which reached significance below this are highlighted in bold. NfL concentrations were natural log-transformed. F Disease group differences between healthy controls and pre-HD in the HD confirmatory cohort from capillary serum samples. p values were generated from multiple linear regressions. Boxes show first and third quartiles, the central band shows the median, and the whiskers show data within 1.5 IQR of the median. The Bonferroni threshold for this experiment was 0.025 (2 comparisons) and statistics which reached significance below this are highlighted in bold. NfL values were natural log-transformed. G Modelling CAG-Age-NfL relationships to show associations between NfL, age, and CAG repeat count using capillary serum samples. Solid lines were produced from our observations using a multiple linear regression model accounting for the main effects of age, CAG, the quadratic effect of age, and the interaction between age and CAG; dashed lines are predictions outside the range of our observations. Separate figures with individual data points for each individual CAG repeat count are provided in Supplementary Fig. 16. HD Huntington’s disease; NfL neurofilament light

References

    1. Alcolea D, Beeri MS, Rojas JC, Gardner RC, Lleó A (2023) Blood biomarkers in neurodegenerative diseases: implications for the clinical neurologist. Neurology 101(4):172–180 - PMC - PubMed
    1. Morris HR (2022) Blood based biomarkers for movement disorders. Acta Neurol Scand 146(4):353 - PMC - PubMed
    1. Yasuno F, Watanabe A, Kimura Y, Yamauchi Y, Ogata A, Ikenuma H et al (2022) Estimation of blood-based biomarkers of glial activation related to neuroinflammation. Brain Behav Immun Health 1(26):100549 - PMC - PubMed
    1. Dehnel T (2013) The European dementia prevention initiative. Lancet Neurol 12(3):227–228 - PubMed
    1. Wilson E, Leyrat C, Baraitser P, Free C (2019) Does internet-accessed STI (e-STI) testing increase testing uptake for chlamydia and other STIs among a young population who have never tested? Secondary analyses of data from a randomised controlled trial. Sex Transm Infect 95(8):569–574 - PMC - PubMed

LinkOut - more resources