. 2025 Jul 10;23(7):e3003239.
doi: 10.1371/journal.pbio.3003239. eCollection 2025 Jul.

H3K4me2 distinguishes a distinct class of enhancers during the maternal-to-zygotic transition

Affiliations

H3K4me2 distinguishes a distinct class of enhancers during the maternal-to-zygotic transition

Matthew D Hurton et al. PLoS Biol. .

Abstract

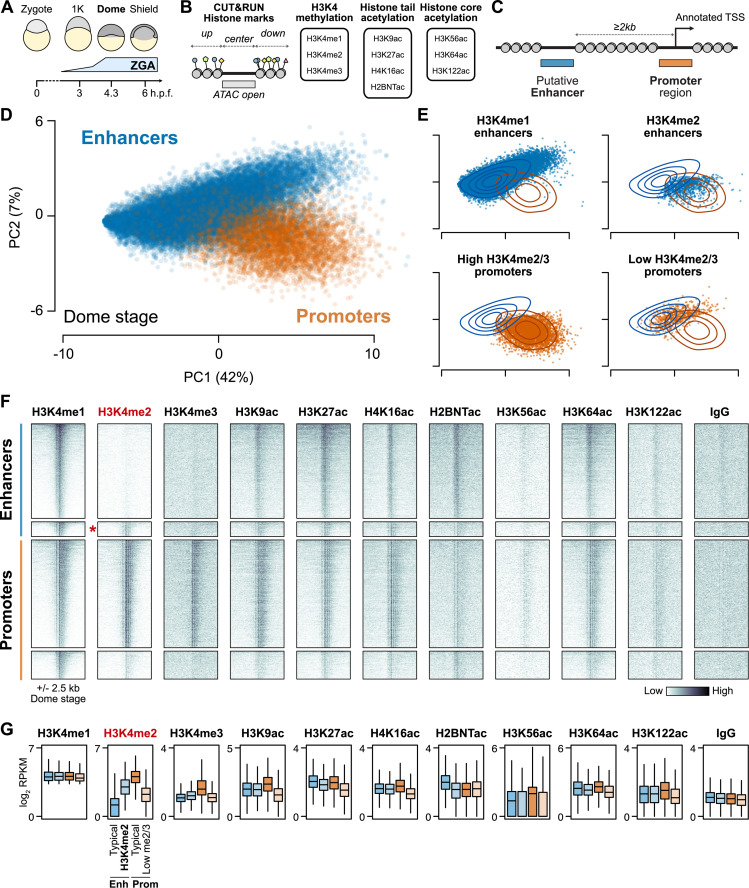
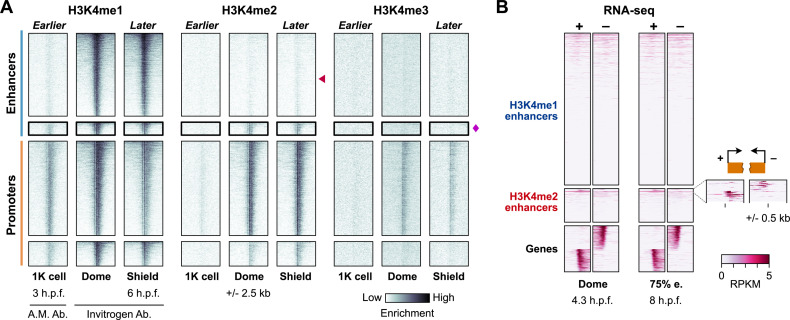
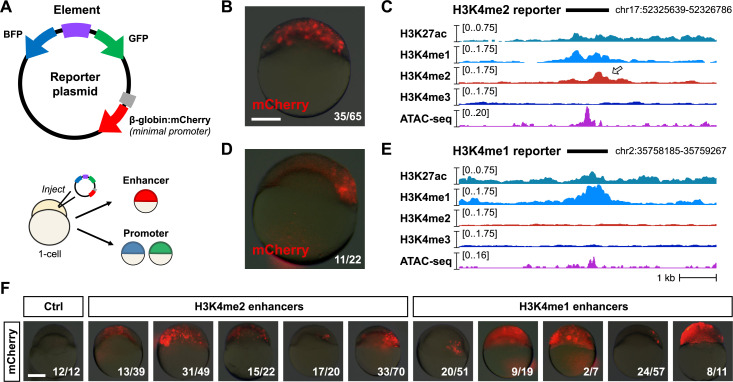
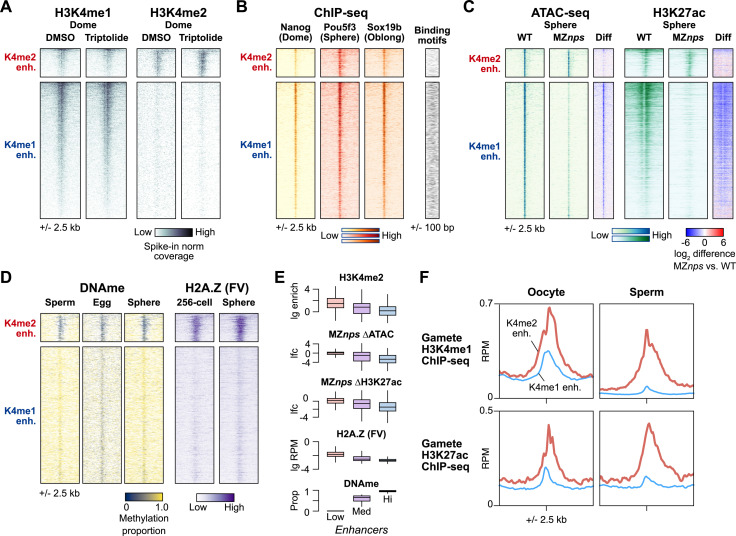
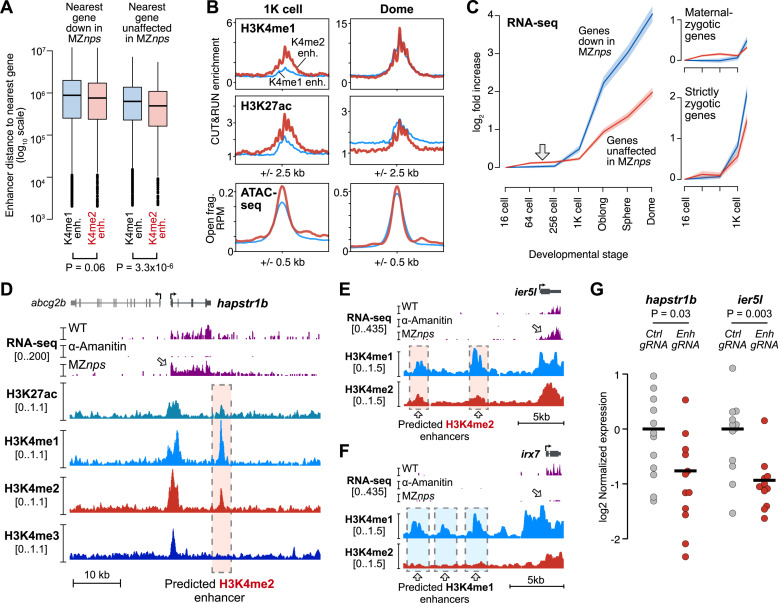
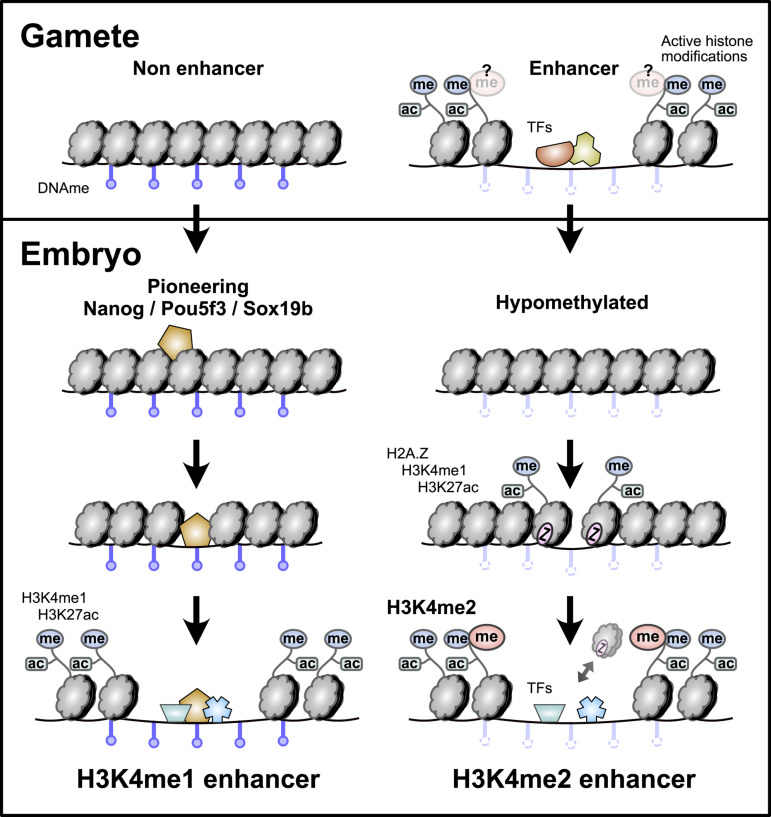
After egg fertilization, an initially silent embryonic genome is transcriptionally activated during the maternal-to-zygotic transition. In zebrafish, maternal vertebrate pluripotency factors Nanog, Pou5f3 (OCT4 homolog), and Sox19b (SOX2 homolog) (NPS) play essential roles in orchestrating embryonic genome activation, acting as "pioneers" that open condensed chromatin and mediate acquisition of activating histone modifications. However, some embryonic gene transcription still occurs in the absence of these factors, suggesting the existence of other mechanisms regulating genome activation. To identify chromatin signatures of these unknown pathways, we profiled the histone modification landscape of zebrafish embryos using CUT&RUN. Our regulatory map revealed two subclasses of enhancers distinguished by presence or absence of H3K4me2. Enhancers lacking H3K4me2 tend to require NPS factors for de novo activation, while enhancers bearing H3K4me2 are epigenetically bookmarked by DNA hypomethylation to recapitulate gamete activity in the embryo, independent of NPS pioneering. Thus, parallel enhancer activation pathways combine to induce transcriptional reprogramming to pluripotency in the early embryo.


Conflict of interest statement

The authors have declared that no competing interests exist.

Figures

Fig 1
Fig 1. Histone modifications distinguish regulatory elements during the maternal-to-zygotic transition.
(A) Schematic of early zebrafish embryogenesis spanning the 1-cell zygote, 1K-cell, dome, and shield stages, showing the timing of zygotic genome activation (ZGA). h.p.f. = hours post fertilization. (B) CUT&RUN read coverage was measured on open chromatin regions defined by ATAC-seq and adjacent 500-bp upstream and downstream regions for 10 histone modifications. (C) Open chromatin regions were classified as TSS-overlapping promoters or TSS-distal putative enhancers. (D) Biplot of the first two principal components (PCs) of a PCA performed on replicate-pooled dome-stage histone modification coverage on open chromatin regions. Points are labeled blue for enhancers, orange for promoters, as defined in (C). Percent of total variance explained per PC in parentheses. The data underlying this figure can be found in S1 Data. (E) PCA biplots separated according to support vector machine (SVM) classification on the first three PCs. “Typical” enhancers and promoters where the SVM classification matched the labels are plotted on the left panels, while regions where SVM classification disagreed with labels are plotted on right panels. Contour lines representing the density of enhancer (blue) and promoter (orange) points in the full PCA plot in (D) are overlaid. The four groups are named after their H3K4 methylation differences. The data underlying this figure can be found in S1 Data. (F) Heatmaps of replicate-pooled CUT&RUN coverage centered on a subset of H3K4me1-marked regions from each of the four groups defined in (E). Individual replicates are shown in S2A Fig. Top to bottom, N = 4,128 typical “H3K4me1 enhancers,” 644 “H3K4me2 enhancers” (marked with a red asterisk), 4,707 typical “High H3K4me2/3” promoters, and 1,224 “Low H3K4me2/3 promoters.” (G) Boxplots summarizing the coverage observed in (F). Boxes are first through third quartiles, center bar median, whiskers extend to 1.5× the interquartile range, outliers are not shown. H3K4me1 was used to select the regions, so differences between groups are expected to be minimal. For each of the remaining marks, significant differences were assessed by individual Kruskal–Wallis tests (H3K4me2, H3K4me3, H3K9ac, H3K27ac, H4K16ac, H2BNTac: P < 1 × 10−100; H3K56ac, H3K26ac, H3K122ac: P < 1 × 10−30). The data underlying this figure can be found in S1 Data. RPKM, reads per kilobase per million.
Fig 2
Fig 2. Genomic profiles over time support a stable subset of H3K4me2-marked enhancers.
(A) Time course of replicate-pooled CUT&RUN coverage for the regions defined in Fig 1. Individual replicates are shown in S3A Fig. Red triangle points to the typical enhancers, which lack H3K4me2 coverage, magenta diamond marks the promoter-like enhancers, which do not gain H3K4me3. For 1K-cell stage, CUT&RUN for an Active Motif H3K4me1 antibody is shown, which yielded stronger signal than the Invitrogen antibody that was used for the other stages (see S2A Fig). (B) Heatmaps of strand-separated RNA-seq coverage centered on the H3K4me1 enhancers and H3K4me2 enhancers, with a subset of gene TSSs shown below to illustrate the expected pattern of unidirectional (−) strand read coverage extending upstream for (−) strand genes and (+) strand coverage extending downstream for (+) strand genes. A zoomed view of coverage at 75% epiboly stage (75% e.) over the top-covered H3K4me2 enhancers is shown to the right. h.p.f. = hours post fertilization, RPKM, reads per kilobase per million.
Fig 3
Fig 3. Reporter assays demonstrate enhancer activity.
(A) Map of the reporter plasmid. Putative regulatory elements are cloned in between divergent mTagBFP2 and EGFP open reading frames to detect (−) strand or (+) strand promoter activity as blue or green fluorescence, respectively. Distal regulation is detected by a far downstream mCherry open reading frame with a minimal mouse β-globin promoter. Reporter plasmids are injected into 1-cell embryos and fluorescence is screened in cells (top of the embryo) in the late blastula / early gastrula. (B) mCherry fluorescence from a reporter (Enh_2a) encoding a putative H3K4me2 enhancer. A brightfield image at 25% opacity is overlaid. Fraction of injected embryos fluorescing is shown on the bottom right. (C) Genome browser tracks showing CUT&RUN (this study) and ATAC-seq open fragment coverage (data from Liu and colleagues, 2018) over the H3K4me2 reporter tested in (B) (black bar). Arrow points to the H3K4me2 enrichment. (D) mCherry fluorescence for an H3K4me1 reporter (Enh_1a). (E) Genome browser track for the reporter tested in (D). (F) mCherry fluorescence for five additional H3K4me2 (Enh_2b-f, middle group) and H3K4me1 enhancers (Enh_1b-f, right group). Control embryos injected with empty reporter plasmids have no fluorescence (left panel). Scale bar = 250 µm.
Fig 4
Fig 4. H3K4me2 enhancers have distinct activation pathways.
(A) Heatmaps over H3K4me2-marked enhancers (K4me2 enh.) and non H3K4me2-marked enhancers (K4me1 enh.) showing replicate-pooled H3K4me1 and H3K4me2 CUT&RUN coverage in control DMSO embryos and embryos treated with the Pol II inhibitor triptolide. Individual replicates are shown in S6A Fig. (B) ChIP-seq coverage for Nanog, Pou5f3, and Sox19b (data from Xu and colleagues, 2012 and Miao and colleagues, 2022). Binding motif occurrence for the three factors over the regions is represented as a heatmap on the right. (C) ATAC-seq open fragment and H3K27ac ChIP-seq coverage in wild-type embryos and MZnps embryos (data from Miao and colleagues, 2022). Log2-fold difference heatmaps of MZnps coverage vs. wild-type are shown on the right for each chromatin feature. (D) DNA methylation proportion from bisulfite sequencing (data from Potok and colleagues, 2013) and H2AFV ChIP-seq coverage (data from Murphy and colleagues, 2018). (E) Boxplots comparing correlated chromatin features on enhancers separated into groups with low (<20%), medium (20%–80%), and high (>80%) DNA methylation. Boxes are first through third quartiles, center bar median, whiskers extend to 1.5× the interquartile range, outliers are not shown. The data underlying this figure can be found in S1 Data. (F) Aggregate plots for the two embryonic enhancer groups (H3K4me2 enhancers, thick red curves; H3K4me1 enhancers, thin blue curves) showing oocyte and sperm H3K4me1 ChIP-seq average coverage (data from Zhang and colleagues, 2018, and Murphy and colleagues, 2018, respectively) and oocyte and sperm H3K27ac (data from Zhang and colleagues, 2018). The data underlying this figure can be found in S1 Data. lg = log2, lfc = log2 fold change, RPM, reads per million.
Fig 5
Fig 5. H3K4me2 enhancers likely regulate non NPS-dependent genes.
(A) Boxplots representing the distance to the nearest gene for each enhancer, for each enhancer/gene combination. Boxes are first through third quartiles, center bar median, whiskers extend to 1.5× the interquartile range, points are outliers. The data underlying this figure can be found in S1 Data. (B) Aggregate plots of replicate-pooled CUT&RUN (this study) and ATAC-seq open fragment coverage (data from Liu and colleagues, 2018). H3K4me2 enhancer average plotted as thick red curves, H3K4me1 enhancer average as thin blue curves. The 1K-stage H3K4me1 CUT&RUN shown here uses the Active Motif antibody, dome stage uses the Invitrogen antibody. The data underlying this figure can be found in S1 Data. (C) Plot of average wild-type RNA-seq log2 fold increase over time for genes according to their fate in MZnps embryos – down in MZnps as classified by Miao and colleagues, 2022 (blue line) or unaffected (red line). Ninety-five % confidence intervals are highlighted. Right panels show the plot stratified into genes with a maternal contribution (maternal-zygotic) or strictly zygotic genes. RNA-seq data from Vejnar and colleagues, 2019. The data underlying this figure can be found in S1 Data. (D–F) Genome browser tracks illustrating regions with predicted enhancers. Top tracks show Click-iT RNA-seq coverage in wild-type,α-amanitin treated, and MZnps embryos (data from Miao and colleagues, 2022). Lower tracks show CUT&RUN coverage (this study). Predicted enhancers are highlighted with dashed boxes. (G) qRT-PCR quantification of zygotic gene expression (hapstr1b or ier5l) in individual F0 CRISPR-Cas9 enhancer loss-of-function embryos targeting the predicted hapstr1b enhancer shown in (D) (left) and two ier5l enhancers simultaneously, shown in (E) (right). The data underlying this figure can be found in S1 Data.
Fig 6
Fig 6. Parallel enhancer activation pathways during the maternal-to-zygotic transition.
Enhancers that lack evidence for gamete activity are hypermethylated, rely on NPS-pioneering, and are marked with H3K4me1 but not H3K4me2 in the embryo. Enhancers that have evidence for gamete activity are hypomethylated, recruit H2A.Z-containing placeholder nucleosomes rather than relying on NPS pioneering, and are marked with H3K4me2.

Update of

Comment in

Similar articles

Cited by

References

    1. Lee MT, Bonneau AR, Giraldez AJ. Zygotic genome activation during the maternal-to-zygotic transition. Annu Rev Cell Dev Biol. 2014;30:581–613. doi: 10.1146/annurev-cellbio-100913-013027 . - DOI - PMC - PubMed
    1. Vastenhouw NL, Cao WX, Lipshitz HD. The maternal-to-zygotic transition revisited. Development. 2019;146(11). doi: 10.1242/dev.161471 . - DOI - PubMed
    1. Blythe SA, Wieschaus EF. Establishment and maintenance of heritable chromatin structure during early Drosophila embryogenesis. Elife. 2016;5:e20148. doi: 10.7554/eLife.20148 . - DOI - PMC - PubMed
    1. Esmaeili M, Blythe SA, Tobias JW, Zhang K, Yang J, Klein PS. Chromatin accessibility and histone acetylation in the regulation of competence in early development. Dev Biol. 2020;462(1):20–35. doi: 10.1016/j.ydbio.2020.02.013 . - DOI - PMC - PubMed
    1. Liu G, Wang W, Hu S, Wang X, Zhang Y. Inherited DNA methylation primes the establishment of accessible chromatin during genome activation. Genome Res. 2018;28(7):998–1007. doi: 10.1101/gr.228833.117 . - DOI - PMC - PubMed

MeSH terms

LinkOut - more resources