. 2025 Jul;603(14):4063-4090.
doi: 10.1113/JP288015. Epub 2025 Jul 10.

Out of the single-neuron straitjacket: Neurons within assemblies change selectivity and their reconfiguration underlies dynamic coding

Affiliations

Out of the single-neuron straitjacket: Neurons within assemblies change selectivity and their reconfiguration underlies dynamic coding

Fabrizio Londei et al. J Physiol. 2025 Jul.

Abstract

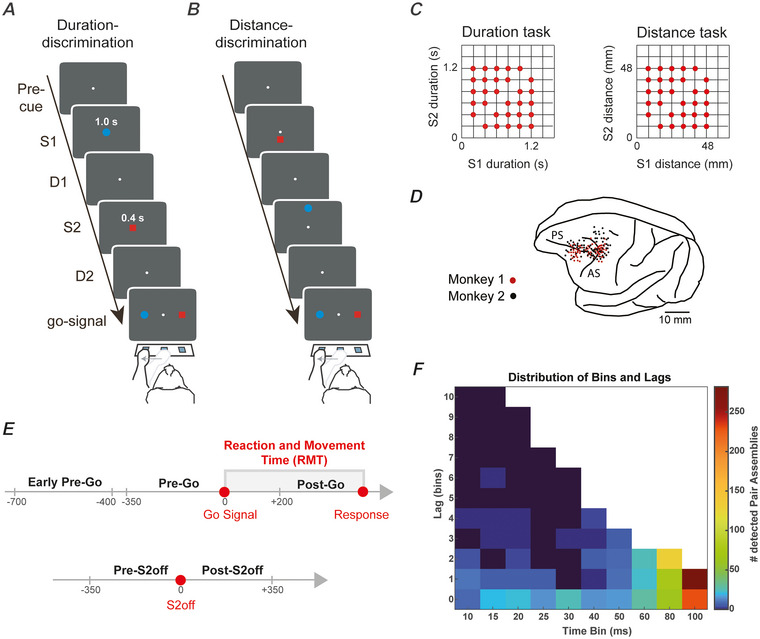
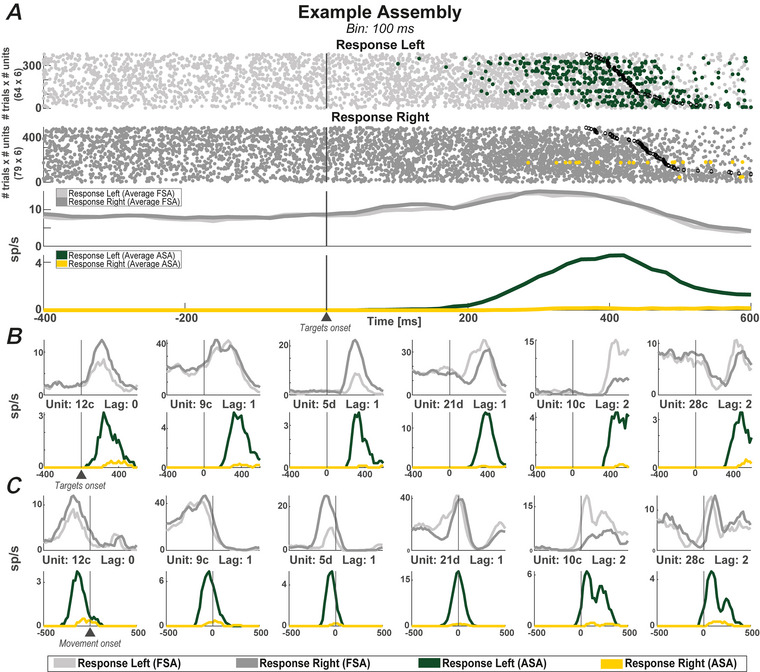
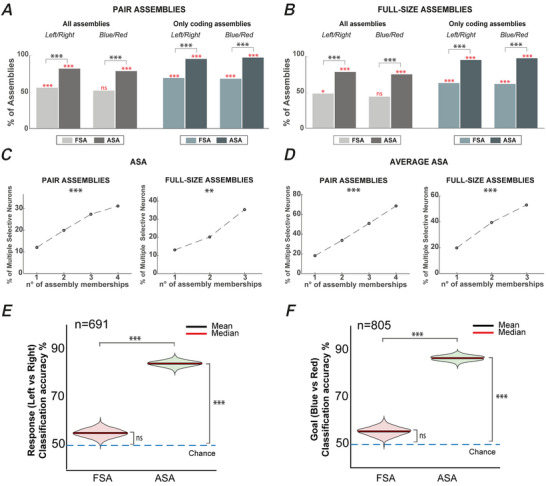
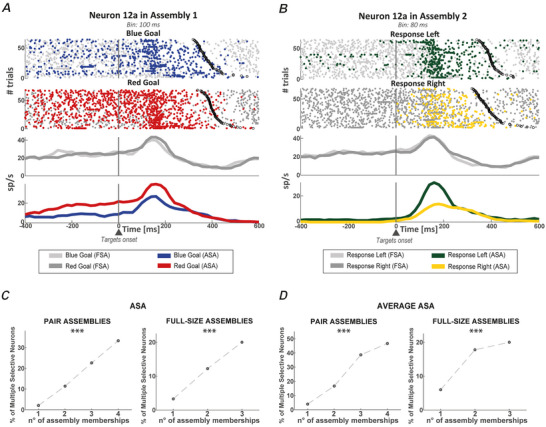
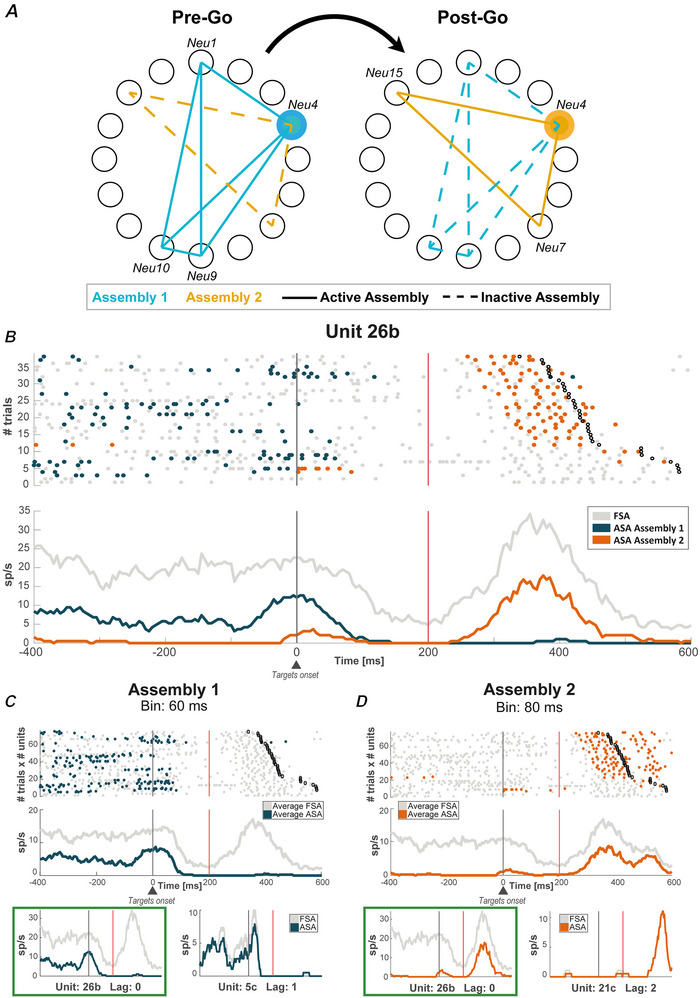
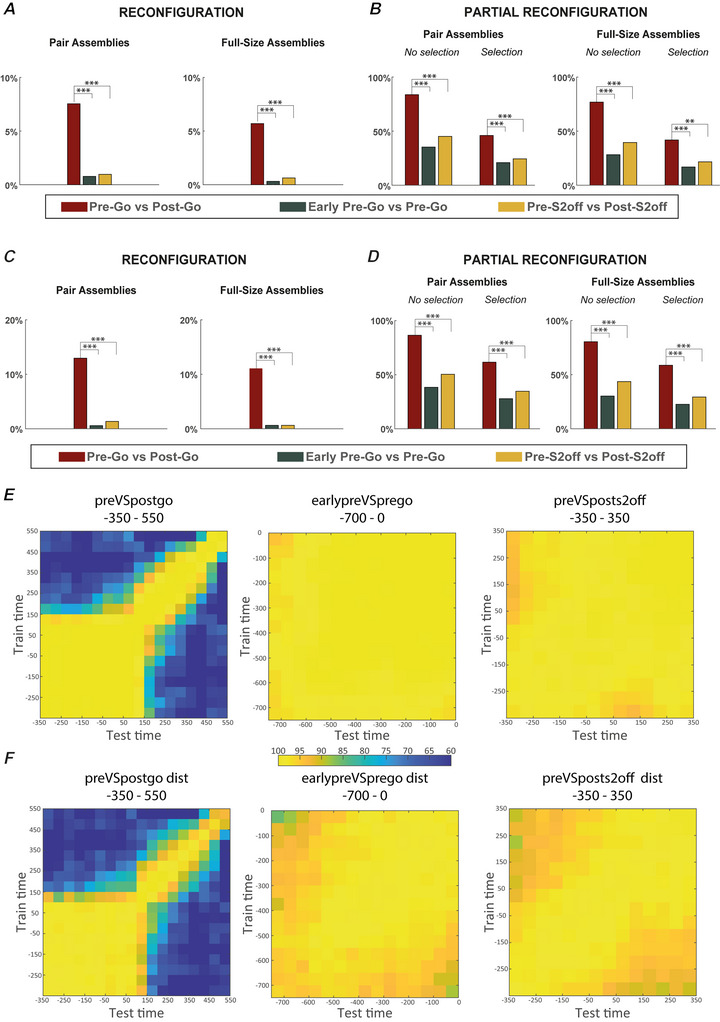
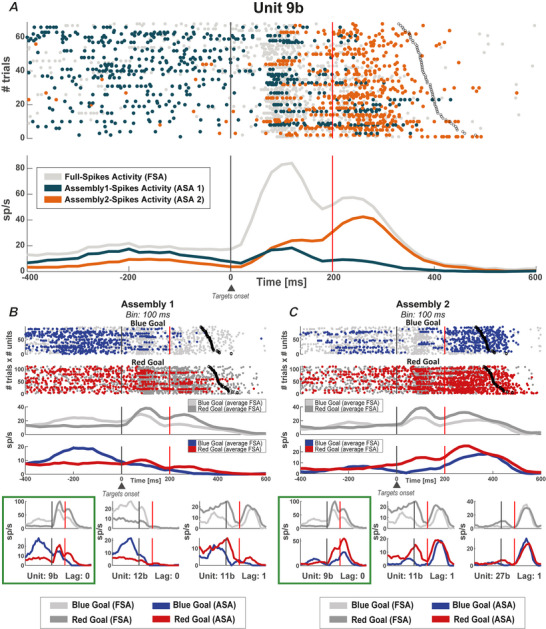
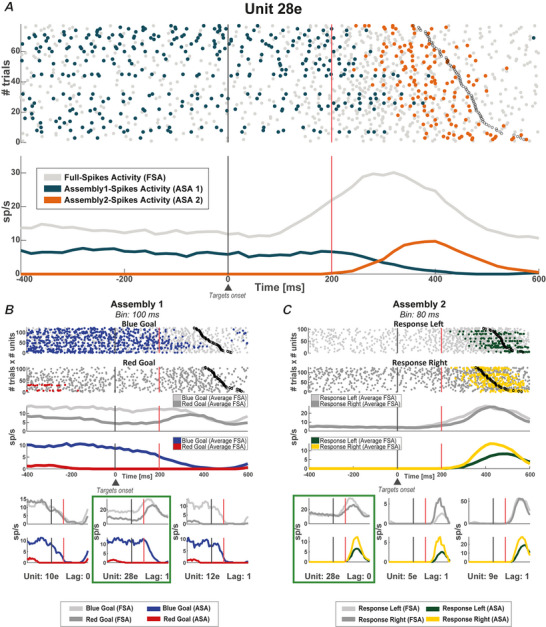
We investigated cell assemblies in the frontal cortex of macaques during two discrimination tasks. Focusing on the period of goal-action transformation, we extracted spikes fired during assembly activation from the full neural activity and showed that the contribution of a neuron to assembly coding, when it co-ordinates with other assembly neurons, differs from its coding in isolation. Neurons, with their flexible participation to multiple assemblies, contributed to the encoding of new information not encoded by the neurons alone. Even non-discriminative neurons acquired selectivity as part of the collective activity of the assemblies. Thus, neurons in their assemblies process distinct information for various purposes as a chess simul master, playing on multiple chessboards. The reconfiguration of the participation of the neurons into different assemblies in the goal-action transformation process translated into a dynamic form of coding, whereas minimal reconfiguration was associated with the static goal coding of the memory period. KEY POINTS: Traditionally, the coding properties of a neuron are studied using all its activity (full-spikes), irrespective of its co-ordination with different groups of neurons. With an assembly centered approach, we can determine the neuron's coding properties not in absolute terms, but relative to the assembly of neurons with which it co-ordinates. When neurons are studied in different assemblies-focusing only on the spikes fired during assembly coordination (assembly-spikes)-they can contribute to the coding of different variables. The coding flexibility of the same neuron in multiple assemblies increases the amount of information it can contribute to encoding compared to isolated neurons. Dynamic coding, as opposed to static coding, as observed during the goal-action transformation process, can be explained by an increase in the reconfiguration of active assemblies, with neurons contributing to the coding of different variables in different epochs, depending on which assembly is active.

Keywords: assembly; dynamic; monkey; prefrontal; reconfiguration; static.


Conflict of interest statement

The authors declare that they have no competing interests.

Figures

Figure 1
Figure 1. Experimental tasks, stimuli distributions and recording locations
A and B, temporal sequence of the task events during duration (A) and distance (B) discrimination tasks. In both tasks, two stimuli were sequentially presented on a screen, separated by a delay and followed, after a second delay, by the reappearance of the two stimuli that served as targets. Monkeys were required to select which of the two stimuli lasted longer, in the duration task, or was presented farther, in the distance task. After their choice, a reward was delivered in the correct trials. The stimulus features (blue circle/red square) in both tasks, position in the distance task (above/below the reference point), distance from the reference point in the distance task, and target position (left/right) in both tasks were pseudorandomly selected. C, distribution of the durations of the stimuli in the duration task and the distances of the stimuli from the reference point in the distance task. D, penetration sites of the two monkeys. E, task epochs used in the reconfiguration analyses include main epochs (Pre‐Go and Post‐Go) and control epochs (Early Pre‐Go and Pre‐Go; Pre‐S2off and Post‐S2off). The delay (D2) between the disappearance of the second stimulus (S2off) and the go‐signal was 0, 400 or 800 ms (not graphically represented). For the reconfiguration analysis, we only used trials with delays of 400 or 800 ms. Grey box ranging from Go‐signal to the response indicates the reaction‐movement time (RMT). F, heatmap of the distribution of bin/lag combinations for the pair assemblies identified by the algorithm in either task. Bin denotes the characteristic time scale at which the assembly was detected, whereas lag refers to the time latency, expressed in time bins, between the activation of the first and the second neuron in the pair assembly. Colorbar reports the number of assemblies. Assemblies with time lags greater than or equal to 10 bins between their constituent neurons were merged together. [Colour figure can be viewed at wileyonlinelibrary.com]
Figure 2
Figure 2. Example of a cell assembly and its filtering effect on neuronal activity
A, six‐neuron assembly detected at a temporal resolution (binning) of 100 ms. At the top, raster plots with trials sorted by response direction are shown. Each dot represents a spike and for each trial are displayed six lines of dots, one for each neuron that belonged to the assembly. At the bottom, mean firing rates of the activity in the left and right response trials for both average FSA (light grey and dark grey) and average ASA (green and yellow). Blank black dots indicate the response time for each trial. B and C, mean firing rate as in the lower part of (A) but displayed for each assembly member with two different alignments for both ASA and FSA. In (B), the original alignment to the go‐signal (target onset) is maintained, whereas, in (C), activities are aligned to the beginning of the movement to emphasize the shift in activation of the units of the assembly across the response time. Each cell's firing rate scale is individually adjusted to highlight its peak activity. [Colour figure can be viewed at wileyonlinelibrary.com]
Figure 3
Figure 3. Same preference and contribution to coding
A and B, percentage of pair assemblies (light grey and dark grey plots in (A) and full‐size assemblies (light grey and dark grey plots in (B) composed of neurons sharing the same coding preference. Concordance in preference was assessed for the response direction and the goal colour. The same statistics are shown for only coding assemblies, again divided by pair assemblies (light blue and dark blue plots in (A) and full‐size assemblies (light blue and dark blue plots in (B). In (A) and (B), red asterisks (*) indicate statistical significance in comparison with chance level, whereas black asterisks (*) indicate statistical significance in the comparison between ASA and FSA. C, percentage of non‐discriminative neurons at the FSA level that contributed to discriminating either the goal colour or the response direction in at least one assembly when they were considered with their ASA (two‐sample t test, P < 0.05). It is important to clarify that the sum of the four data points shown in Fig. 3C (left) approaches ∼100% merely by chance. D, same as (C), considering average ASA. Percentage of non‐discriminative neurons at the FSA level, that contributed to discriminating either the goal colour or the response direction in at least one assembly when they were considered with their ASA (two‐sample t test, P < 0.05). C and D, results are reported for both pair assemblies (left) and full‐size assemblies (right) divided according to the number of assemblies to which a neuron belongs. These percentages increased with the number of assemblies formed by a neuron. This increase is significantly higher than what was expected by chance (Cochran–Armitage test for trend) for both pair assemblies and full‐size assemblies. *P < 0.05; **P < 0.01; ***P < 0.001; ns, non‐significant. Table 1 reports the exact P values. E, classification accuracy in a population of response direction non‐selective neurons at the FSA level, taking into account their FSA activity and their ASA activity in one of the assemblies to which they belong. F, same as (E) considering the population of goal colour non‐selective neurons at the FSA level. In (E) and (F), ***η < 0.001, **η < 0.01 and *η < 0.05; ns, non‐significant; n, number of neurons. [Colour figure can be viewed at wileyonlinelibrary.com]
Figure 4
Figure 4. Multiple selectivity of neurons taking part in multiple assemblies
Assembly 1 is formed by neuron 12a and neuron 41a (not shown) and was detected at a temporal resolution of 100 ms. Assembly 2 is formed by neurons 12a and 9a (not shown) and was detected at a temporal resolution of 80 ms. A, raster plot of the activity of neuron 12a at the level of both FSA (light grey and dark grey dots) and ASA (blue and red dots) with mean firing rates at the bottom. Activities are sorted by blue and red goals. B, same scheme as in (A), but with activities sorted by left and right responses. Light grey and dark grey dots represent FSA, whereas green and yellow dots represent ASA. Neuron 12a, which was not selective for either the response or the goal, had coding properties only when its activity was considered as part of the assembly activation in the different assemblies to which it belongs. In Assembly 1 (A), neuron 12a contributed to encode the red goal but not the response direction (not shown). On the other hand, neuron 12a contributed to encode the left response in Assembly 2 but not the goal (not shown). C, percentage of non‐multiple selectivity neurons, referring to neurons encoding none or only one of the two variables (response direction or goal colour) with their FSA, that contributed to the coding of both variables (multiple selectivity) with their ASA. D, same as (C) considering average ASA. Percentage of non‐selective neurons at the FSA level that were part of at least one coding assembly, that is, selective for either of the two variables with its average ASA. C and D, results are reported for both pair assemblies (left) and full‐size assemblies (right) divided according to the number of assemblies to which a neuron belongs. These percentages increase significantly with the number of assemblies in which a neuron participates (Cochran–Armitage test for trend) for both pair and full‐size assemblies. ***P < 0.001. Table 1 reports the exact P values. [Colour figure can be viewed at wileyonlinelibrary.com]
Figure 5
Figure 5. Reconfiguration
A, schematic representation of a reconfiguration. Filled and dotted lines indicate, respectively, active and inactive assemblies. Neuron Neu4 belongs to both Assembly 1 (cyan) and Assembly 2 (yellow). It is active with its ASA in Assembly 1 only in the Pre‐Go epoch when it co‐ordinates with Neu1, Neu9 and Neu10. The same neuron is active with its ASA within Assembly 2 only in the Post‐Go epoch when it co‐ordinates its firing rate with neurons Neu15 and Neu7. B, neuron (26b) with an activity reconfiguration between the Pre‐ and Post‐Go epochs through its participation in different assemblies, active only before (Assembly 1) or only after (Assembly 2) the go‐signal. The activity is displayed without sorting by any variable. C, upper: the raster plot and the average FSA and ASA of the neurons of Assembly 1 are shown; lower: the individual mean ASA of the two neurons composing this assembly, one on the left (unit 26b), as shown in (A), and the other (5c) on the right. D, same as in (C) but for Assembly 2 with a different neuron (21c) in the assembly with neuron 26b. In (B) and (D), the black vertical bar indicates target onset (i.e. the end of the Pre‐Go epoch) and the red vertical bar indicates the beginning of the Post‐Go epoch, which ends at the response time (black circles). In (C) and (D), the green boxes indicate the neuron (unit 26b) shown in (B). [Colour figure can be viewed at wileyonlinelibrary.com]
Figure 6
Figure 6. Reconfiguration and cross‐temporal decoding
A, percentage of neurons exhibiting activity reconfigurations between each of the three pairs of epochs considered. The results are presented for both pair and full‐size assemblies. B, same as in (A) but considering partial activity reconfigurations. The results are presented both for the entire population of neurons belonging to more than one assembly and for the selected population with no statistically significant difference in the FSA between each pair of epochs and for both pair and full‐size assemblies. C, percentage of neurons with activity reconfigurations between each of the three pairs of epochs but considering the average ASA. The same analysis was performed for both pair assemblies and full‐size assemblies. D, same as in (C) but considering partial activity reconfigurations. We considered two different populations: the entire population of neurons belonging to more than one assembly (no selection panel) and the subpopulation with no statistically significant difference in the FSA between each pair of epochs (selection panel). The same analysis was performed for both pair assemblies and full‐size assemblies. In (A) to (D), statistical significance was assessed using a chi‐squared test. **P < 0.01, ***P < 0.001. Table 1 reports the exact P values. E, cross‐temporal population decoding for the goal colour in the main epochs of interest (Pre‐Go vs. Post‐Go). In the left colour map, we used both tasks, whereas, in the right colour map, we used only the distance task as a control. F, cross‐temporal population decoding for the goal colour in the control epochs (early Pre‐Go vs. Pre‐Go, left colour map, and Pre‐S2off vs. Post‐S2off, right colour map). In this case, only data from the distance task were used. Training and testing time bins are reported on the y‐ and x‐axis, respectively, and the values are colour‐coded in the classification accuracy matrices. [Colour figure can be viewed at wileyonlinelibrary.com]
Figure 7
Figure 7. Activity reconfiguration in a switch neuron
A, neuron (9b) with an activity reconfiguration between Pre‐ and Post‐go epochs through its participation in different assemblies. B, upper: the raster plot and the average FSA and ASA of neurons in Assembly 1 are sorted by goal colour; lower: the individual mean ASA for the two‐goal colours of the three neurons composing Assembly 1 are shown: the first (unit 9b) is displayed on the left, as shown in (A), the second (12b) is displayed in the centre and the third (11b) is displayed on the right. C, same as in (B) but for Assembly 2 with two neurons shared with Assembly 1 (9b, 11b) and a third different neuron (27b) not shared with Assembly 1, displayed on the right. In (A) to (C), the black vertical bar indicates the target onset (i.e. the end of the Pre‐Go epoch) and the red vertical bar indicates the beginning of the Post‐Go epoch, which ends at the response time (black circles). In (B) and (C), the green boxes indicate the neuron (9b) in (A). [Colour figure can be viewed at wileyonlinelibrary.com]
Figure 8
Figure 8. Activity reconfiguration in a persistent neuron
A, neuron (28e) with an activity reconfiguration between Pre‐ and Post‐go epochs through its participation in different assemblies. The two assemblies are active in exclusive epochs. B, upper: the raster plot is sorted by goal colour and the average FSA and ASA of the neurons of Assembly 1 are shown sorted by each goal; lower: the individual average ASA composing Assembly 1 for the three neurons, sorted by goal colour, that contributed to encode the blue goal are presented: the first on the left (unit 10e), as shown in (A), the second (28e), as presented in (A), at the centre, and the third (12e) on the right. C, same as in (B) but for Assembly 2 with one neuron shared with Assembly 1 (28e), and with two new neurons (5e and 9e) not shared with Assembly 1. All neurons in Assembly 2 shared a preference for the right response. In (A) to (C), the black vertical bar indicates the target onset (i.e. the end of the Pre‐Go epoch) and the red vertical bar indicates the beginning of the Post‐Go epoch, which ends at the response time (black circles). In (B) and (C), the green boxes indicate the neuron (28e) in (A). [Colour figure can be viewed at wileyonlinelibrary.com]

Similar articles

References

    1. Abbott, L. F. , & Dayan, P. (1999). The effect of correlated variability on the accuracy of a population code. Neural Computation, 11(1), 91–101. - PubMed
    1. Backen, T. , Treue, S. , & Martinez‐Trujillo, J. C. (2018). Encoding of spatial attention by primate prefrontal cortex neuronal ensembles. eNeuro, 5(1). 10.1523/ENEURO.0372-16.2017 - DOI - PMC - PubMed
    1. Bardella, G. , Franchini, S. , Pani, P. , & Ferraina, S. (2024). Lattice physics approaches for neural networks. Iscience, 27(12), 111390. - PMC - PubMed
    1. Bardella, G. , Giuffrida, V. , Giarrocco, F. , Brunamonti, E. , Pani, P. , & Ferraina, S. (2024). Response inhibition in premotor cortex corresponds to a complex reshuffle of the mesoscopic information network. Network Neuroscience, 8(2), 597–622. - PMC - PubMed
    1. Benjamini, Y. , & Hochberg, Y. (1995). Controlling the false discovery rate: A practical and powerful approach to multiple testing. Journal of the Royal Statistical Society: Series B Methodology, 57(1), 289–300.

LinkOut - more resources