. 2025 Jul 10;389(6756):169-175.
doi: 10.1126/science.adi8828. Epub 2025 Jul 10.

Macrophage-derived oncostatin M repairs the lung epithelial barrier during inflammatory damage

Affiliations

Macrophage-derived oncostatin M repairs the lung epithelial barrier during inflammatory damage

Daisy A Hoagland et al. Science. .

Abstract

Tissue repair programs must function alongside antiviral immunity to restore the lung epithelial barrier following infection. We found that macrophage-derived oncostatin M (OSM) counteracted the pathological effects of type I interferon (IFN-I) during infection and damage in mice. At baseline, OSM-deficient mice exhibited altered alveolar type II (ATII) epithelial cell states. In response to influenza or viral mimic challenge, mice lacking OSM exhibited heightened IFN-I responses and increased mortality. OSM delivery to the lung induced ATII proliferation and was sufficient to protect deficient mice against morbidity. Furthermore, OSM promoted organoid formation despite the growth-inhibitory effects of IFN-I. These findings identify OSM as an indispensable macrophage-derived growth factor that maintains the homeostasis of lung epithelial cells and promotes their proliferation to overcome IFN-I-mediated immunopathology.


Figures

Fig 1.
Fig 1.. OSM is required for maintenance of ATII epithelial cell transcriptional states and for host survival during IAV infection.
(A to C) Mice were infected intranasally (i.n.) with 225 to 300 plaque-forming units (PFU) of A/WSN/1933 (H1N1). BALF and plasma were collected at indicated time points, and OSM protein levels were assessed by enzyme-linked immunosorbent (ELISA) (A) (n = 3 mice per group). Whole-lung RNA was collected at indicated time points and Osm transcript expression measured by reverse transcription quantitative polymerase chain reaction (RT-qPCR) (B) (n = 3 mice per group). Percent initial body weight (left panel) and survival curve (right panel) after infection (C) (n = 3 to 4 mice per group); representative of at least two independent experiments. (D to H) Mice were infected i.n. with 225 PFU of A/WSN/1933 (H1N1) or mock-infected with PBS. Lungs were collected from IAV-infected mice at 2 days post-infection (2 dpi) and from mock-infected mice (0 dpi) for scRNA-seq analysis (n = 2 mice per group). Uniform manifold approximation and projection (UMAP) clustering and cell cluster annotation of scRNA-seq data from the lungs of mock-infected (0 dpi) and IAV-infected mice at 2 dpi (26,978 total cells) (D). Osm expression in annotated cell clusters in wild-type mice (15,349 cells) (E). Osmr expression in annotated cell clusters in wild-type mice (F). UMAP of re-clustered ATII subpopulations across genotypes (G). UMAP of reclustered ATII subpopulations in all mice (left panel) and stacked bar plot of ATII subpopulation percentages at baseline or 2 dpi across genotypes (right panel) (H). Female mice were used for experiments in this figure. Symbols represent mean data, with error bars indicating SD; ****P ≤ 0.0001, Two-way analysis of variance (ANOVA) up to day 8 for (C), left panel; log-rank Mantel-Cox test for (C), right panel. Scale bar represents log-normalized gene expression for (E) and (F).
Fig 2.
Fig 2.. OSM deficiency results in exacerbated IFN-I responses and lung immunopathology during IAV infection and increased susceptibility to viral mimic challenge.
(A to C) Mice were infected i.n. with 225 PFU of A/WSN/1933 (H1N1) or mock-infected with PBS (0 dpi). Whole-lung RNA was collected at indicated time points and Ifit1 transcript expression measured by RT-qPCR (A) (n = 3 to 4 mice per group). Protein from BALF was collected at indicated time points, and IFN-α (B) and IFN-β (C) protein levels were assessed by ELISA (n = 4 to 6 mice per group). (D to G) Mice were infected i.n. with 225 to 450 PFU of A/WSN/1933 (H1N1). Representative histological images of mouse lungs at baseline and throughout IAV infection (D). Histological scoring of the percentage of the lung exhibiting severe damage throughout IAV infection (E) (n = 3 to 5 mice per group). BALF was collected at 2 dpi for total protein quantification (F) (n = 4 to 6 mice per group). Lung barrier permeability was assessed with an Evans blue dye assay on BALF at 6 dpi (G) (n = 5 to 7 mice per group); representative of at least two independent experiments. (H to J) Mice were treated intratracheally (i.t.) with 33.75 to 50 μg of poly(I:C) daily for 5 consecutive days. Schematic of experimental design (H). BALF was collected at indicated time points and OSM protein levels detected by ELISA (I) (n = 4 to 5 mice per group). Mice were monitored for body weight (left panel) and survival (right panel) (J) (n = 3 mice per group); representative of at least two independent experiments. Male mice were used for (G) and (J), and female mice were used for the remaining experiments. Relative expression calculated as (2−ΔCt)*1000. In (A to G), symbols represent individual mice, and bars are means. In (I) and (J), symbols represent mean data. In all graphs, error bars indicate SD, *P ≤0.05, ** P ≤0.01, *** P ≤0.001, **** P ≤0.0001, ns = not significant. Two-way ANOVA for (A) and (E); Mann-Whitney U test for (B), (C), and (F); unpaired Student’s t test for (G), two-way ANOVA up to day 7 for (J), left panel; and log-rank Mantel-Cox test for (J) right panel. LOD, level of detection.
Fig 3.
Fig 3.. Macrophage-derived OSM is required for survival during poly(I:C) challenge.
(A to G) Mice were treated i.t. with 33.75 to 50 μg of poly(I:C) daily for 5 consecutive days. Mice were monitored for body weight (left panel) and survival (right panel) (A) (n = 5 to 7 mice per group). BALF was collected at 7 days post-initial challenge (dpc), and IFN-β protein levels were detected by ELISA (n = 4 mice per group) (B). Whole-lung RNA was collected at 7 dpc and Ifit1 transcript expression measured by RT-qPCR (C) (n = 6 mice per group). Representative of at least two independent experiments for (A) to (C). Lung barrier permeability was assessed with an Evans blue dye assay on BALF at 7 dpc (D) (n = 3 to 5 mice per group). BALF was collected at 7 dpc for total protein quantification (n = 4 mice per group) (E). Lungs were collected and total epithelial cell (F) and ATII cell (G) numbers at 7 dpc were determined with flow cytometry (n = 11 mice per group); pooled from three independent experiments. (H) Mice were treated i.t. with 33.75 to 50 μg of poly(I:C) daily for 5 consecutive days. In addition, mice were treated intravenously (i.v.) with either 200 μg of anti-mouse IFNAR1 or isotype control antibody diluted in 100 μl PBS on −1, 0, 1, 3, and 4 dpc. Mice were weighed daily (n = 3 to 4 mice per group). (I to L) Mice were treated i.t. with 1 μg of mouse recombinant (rOSM) in addition to 33.75 to 50 μg of poly(I:C) daily for 5 consecutive days. Mice were weighed daily (I) (n = 4 to 5 mice per group). BALF was collected at 7 dpc and IFN-β protein levels detected by ELISA (J) (n = 6 to 8 mice per group). Lungs were collected and Ki67+ ATII (K), and total ATII (L) numbers at 7 dpc were determined with flow cytometry (n = 5 mice per group). Representative of at least two independent experiments for (H) to (L). A combination of female and male mice was used for experiments in this figure. Relative expression calculated as (2−ΔCt)*1000. In (A), (H), and (I), symbols represent mean data. In (B) to (G) and in (J) to (L), symbols represent individual mice, and bars are means. In all graphs, error bars indicate SD; * P ≤0.05, ** P ≤0.01, *** P ≤0.001, **** P ≤0.0001, ns = not significant. Two-way ANOVA up to day 7 for (A), left panel, up to day 6 for (H), and up to day 15 for (I); log-rank Mantel-Cox test for (A), right panel; Mann-Whitney U test for (B) and (D), unpaired Student’s t test for (C), (E), (F), and (G); nonparametric one-way ANOVA for (J); and one-way ANOVA for (K) and (L). LOD, level of detection.
Fig 4.
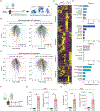
Fig 4.. Administration of OSM rescues ATII cell states and induces proliferation.
(A to E) Mice were treated i.t. with either PBS or 1 μg of OSM daily for 7 consecutive days. The following day, lungs were collected, and ATII cells were sorted for bulk RNA-seq analysis. Schematic representation of experimental design (A). Volcano plot for cluster 1 (OSM-independent) ATII gene signature of PBS-treated Osm+/+ versus PBS-treated Osm−/− mice and volcano plot of rOSM-treated Osm−/− versus PBS-treated Osm−/− mice (B). Volcano plot for cluster 2 (OSM-dependent) ATII gene signature of PBS-treated Osm+/+ versus PBS-treated Osm−/− mice and volcano plot of rOSM-treated Osm−/− versus PBS-treated Osm−/− mice (C). Heatmap depicting the expression levels of genes differentially expressed between groups (twofold differential) and k-means clustered by row. Rows represent genes, and columns represent samples (D). The resulting clusters were analyzed using MSigDB pathway enrichment in Enrichr. The top five enriched pathways for each cluster are displayed. The dotted line represents the significance threshold for the adjusted P value, set at P < 0.05 (E). [n = 2 to 3 mice per group for (A) to (E)]. (F to H) Mice received daily i.t. administrations of 1 μg mouse rOSM and i.p. injections of 1 μg EdU for 3 consecutive days. Schematic representation of experimental design (F). Lungs were processed 24 hours after the final treatment, and Ki67+ ATII (G) and EdU+ ATII (H) cell proportions (left panels) and numbers (right panels) were determined with flow cytometry (n = 5 mice per group); representative of at least two independent experiments. Female mice were used for experiments in this figure. In (G) and (H), symbols represent individual mice, bars are means, and error bars indicate SD; ** P ≤0.01. Mann-Whitney U test for (G) and (H). TNF-alpha, tumor necrosis factor alpha, UV response Dn, ultraviolet response down-regulation; mTORC1, mammalian target of rapamycin complex 1; KRAS, Kristen rat sarcoma virus.
Fig 5.
Fig 5.. OSM overcomes growth suppressive effects of IFN-I to promote epithelial proliferation.
Alveolar organoids were cultured in the presence or absence of IFN-I (200 U/mL; 1:1 mixture of rIFN-α and rIFN-β1) supplemented with mouse rOSM (50 ng/mL), rIL-1β (20 ng/mL), or rIL-6 (50 ng/mL). (A) Experimental schematic. Organoids were seeded and allowed to grow for 5 days before treatment. IFN-I treatment began on day 5. Images were taken for analysis 14 days after seeding. (B) Representative images of organoid cultures on day 14 after seeding. (C) Quantification of organoid forming efficiency (OFE) (n = 4 samples per group). (D) Quantification of mean organoid area (n = 4 samples per group). (E) Overall model. At steady state, AMs produce OSM which maintains ATII gene expression and function. Upon infection and/or damage of the lung, moMacs and other myeloid cells infiltrate into the alveoli, resulting in elevated OSM levels. This induces proliferation of ATIIs despite ongoing inflammation and antiproliferative IFN-I signaling, restoring the epithelial barrier of the lung. Experiments in this figure are representative of two independent experiments. In (C) and (D), symbols represent individual samples, bars are means and error bars indicate SD; * P ≤0.05, ** P ≤0.01, *** P ≤0.001, **** P ≤0.0001, ns = not significant, Brown-Forsythe and Welch ANOVA for (C) and ordinary one-way ANOVA for (D).

Update of

References

    1. Högner K, Wolff T, Pleschka S, Plog S, Gruber AD, Kalinke U, Walmrath H-D, Bodner J, Gattenlöhner S, Lewe-Schlosser P, Matrosovich M, Seeger W, Lohmeyer J, Herold S, Macrophage-expressed IFN-β Contributes to Apoptotic Alveolar Epithelial Cell Injury in Severe Influenza Virus Pneumonia. Plos Pathog 9, e1003188 (2013). - PMC - PubMed
    1. Major J, Crotta S, Llorian M, McCabe TM, Gad HH, Priestnall SL, Hartmann R, Wack A, Type I and III interferons disrupt lung epithelial repair during recovery from viral infection. Sci New York N Y 369, 712–717 (2020). - PMC - PubMed
    1. Diamond MS, Kanneganti T-D, Innate immunity: the first line of defense against SARS-CoV-2. Nat. Immunol 23, 165–176 (2022). - PMC - PubMed
    1. McNab F, Mayer-Barber K, Sher A, Wack A, O’Garra A, Type I interferons in infectious disease. Nat Rev Immunol 15, 87–103 (2015). - PMC - PubMed
    1. Wynn TA, Chawla A, Pollard JW, Macrophage biology in development, homeostasis and disease. Nature 496, 445–455 (2013). - PMC - PubMed

MeSH terms

LinkOut - more resources