. 2025 Sep 1;199(1):kiaf300.
doi: 10.1093/plphys/kiaf300.

The trehalose 6-phosphate pathway coordinates dynamic changes at the shoot apical meristem in Arabidopsis thaliana

Affiliations

The trehalose 6-phosphate pathway coordinates dynamic changes at the shoot apical meristem in Arabidopsis thaliana

Magdalena Musialak-Lange et al. Plant Physiol. .

Abstract

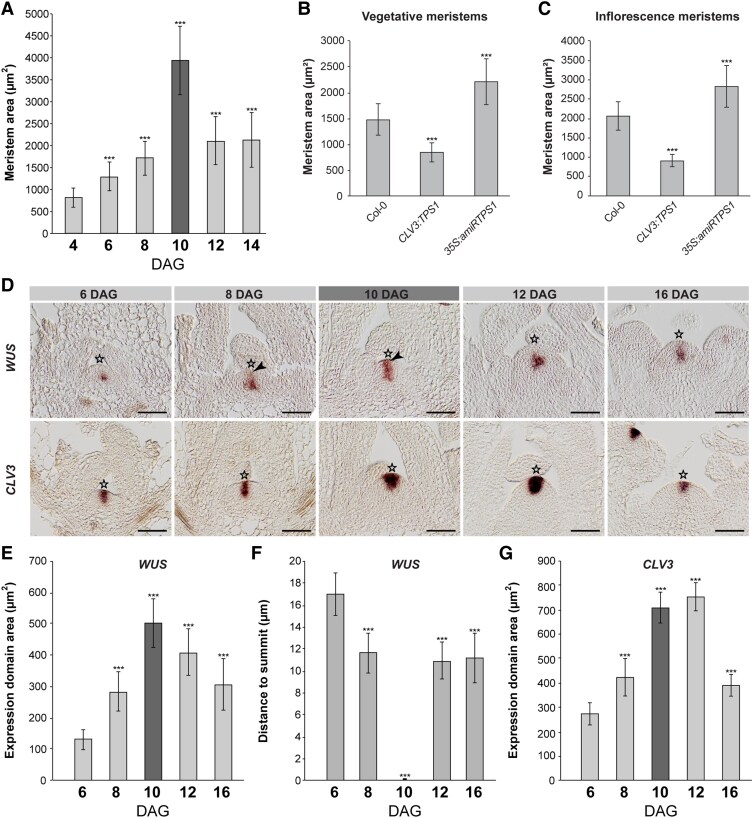
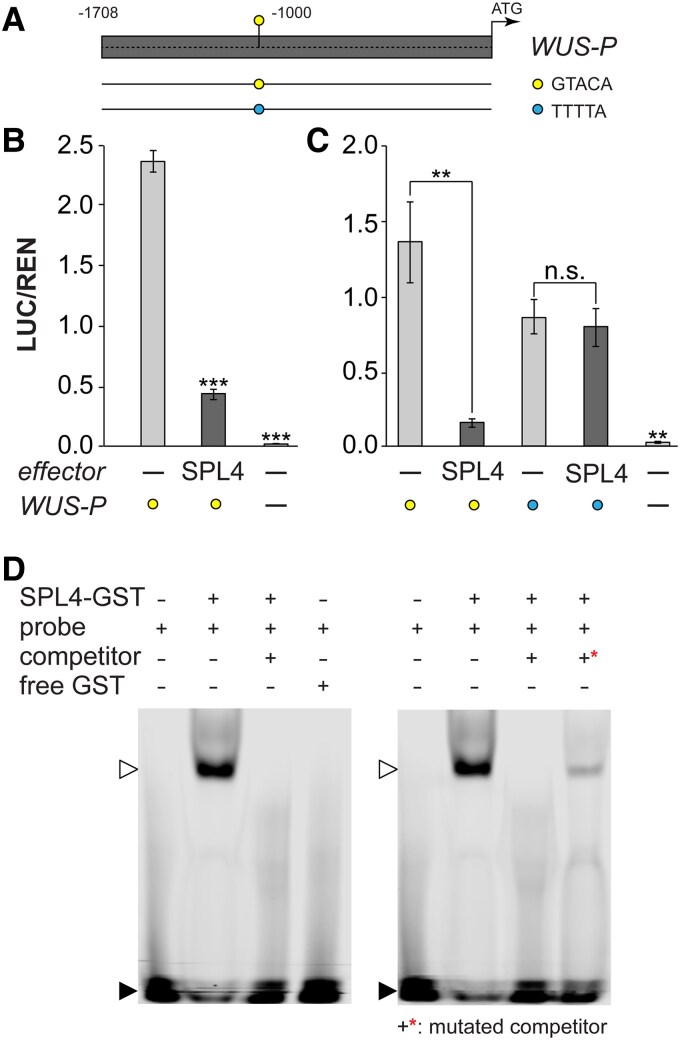
A plant's stem cell population in the shoot apical meristem (SAM) is maintained by WUSCHEL (WUS) and CLAVATA3 (CLV3). SAM size is dynamic and undergoes a more than 2-fold expansion upon transition to reproductive growth. The mechanism controlling this doming is largely unknown; however, coinciding increased trehalose 6-phosphate (T6P) levels suggest a participation of the T6P pathway in Arabidopsis (Arabidopsis thaliana). Moreover, lines misexpressing or with reduced expression of TREHALOSE PHOSPHATE SYNTHASE1 (TPS1) have smaller and larger SAMs, respectively. Here, we show that TREHALOSE PHOSPHATE PHOSPHATASEJ (TPPJ) is directly regulated by WUS. Changing TPPJ transcript levels in the outer layer affects SAM size and flowering time, and its reduction in the late-flowering clv3 mutant restores wild-type flowering. This is associated with altered mature microRNA156 abundance and expression of the SQUAMOSA PROMOTER-BINDING PROTEIN-LIKE genes SPL3, SPL4, SPL5, and SPL9. Furthermore, SPL4 is controlled by WUS, while SPL4 directly represses WUS, establishing negative feedback regulation. This feedback loop is important for age pathway-induced flowering involving the T6P pathway and suggests dynamic feedback regulations between central meristem maintenance and flowering time regulators with sugar signaling throughout development.


Conflict of interest statement

Conflict of interest statement. None declared.

Figures

Figure 1.
Figure 1.
The T6P pathway impacts Arabidopsis SAM size during development. A) SAM area throughout development. n = 15 per time point. B) Vegetative and C) inflorescence SAM size of CLV3:TPS1 and 35S:amiRTPS1 lines. n = 10 per genotype and time point. D)  WUS and CLV3 expression by RNA in situ hybridization in vegetative (6 and 8 DAG), transition (10 DAG, marked dark gray) and inflorescence SAMs (12 and 16 DAG) of LD-grown Col–0 plants. Arrowhead indicates WUS expression in outer SAM layer. E)  WUS expression domain sizes, F)  WUS expression domain distance to SAM summit, and G)  CLV3 expression domain area, in vegetative, transition (dark gray) and inflorescence SAMs of LD-grown wild-type plants. n > 10 per time point. Error bars denote Sd; significance was calculated based on a Student's t-test, ***P < 0.001. Star indicates SAM summit. Scale bars are 25 µm.
Figure 2.
Figure 2.
TPPJ plays a role at the Arabidopsis SAM. A, B)  TPPJ expression by RNA in situ hybridization on longitudinal sections through inflorescence SAMs of A) Col-0 and B)  clv3-7 and by RT-qPCR in apices collected from C)  clv3-7, clv3-10, and D)  35S:TPPJ plants. Each n = 3 per genotype. E) Expression of TPPJ by RNA in situ hybridization on longitudinal sections through inflorescence SAMs of Col-0 and 35S:TPPJ.  F) SAM size of plants overexpressing TPPJ. n = 10 per genotype. Error bars denote Sd; significance calculated by 1-way ANOVA C, D) and Student's t-test F), ***P < 0.001. Black and white arrowheads indicate first and second meristem layers, respectively. Stars indicate SAM summit. Scale bars are 50 µm.
Figure 3.
Figure 3.
WUS directly regulates TPPJ in the Arabidopsis SAM. A) Overview of TPPJ 5′ regulatory region with putative TPPJWUS sites (gray circles, black boxes), position of ChIP-PCR amplicons corresponding to the results shown in C) to E). Boxes marked with I, II, and III indicate 5′ TPPJ regions with in total 7 confirmed core TPPJWUS sites—I: −2,795 to −2,789 bp, II: −2,073 to −1,830 bp, and III: −652 to −564 bp. Sequence location and lengths used in B) are indicated with #1 to 6. B) Protoplast transactivation assay showing activation of the GUS reporter when coupled to the regions indicated in A), relative to LUC activity. c indicates untransformed control. n = 6. C to E) Enrichment of C) Region I, D) Region II, and E) Region III as indicated in A) measured by ChIP–PCR relative to the input. PB, postbinding fraction. n = 3. F) EMSA for WUS binding to the indicated regions (A, I to III). Note the shifted band in the presence of WUS protein (open arrowhead) and the nonshifted fraction (closed arrowhead). Error bars denote Sd; significance based on 1-way ANOVA, ***P < 0.001.
Figure 4.
Figure 4.
The role of TPPJ in the outer Arabidopsis SAM layer. A) Meristem area of Col-0, ML1:amiRTPPJ V1 and V2. n = 10 per genotype. B, C) Flowering time of B)  ML1:amiRTPPJ and C)  clv3-10;ML1:amiRTPPJ shown as days to bolting relative to Col-0. n = 22 per genotype. V1 and V2 indicate 2 independent versions of artificial microRNAs designed to target TPPJ transcript. The whiskers indicate the highest and lowest values, the box indicates the interquartile range including the upper and lower quartiles, the center line indicates the median, the black dots indicate the mean, and the width indicates the abundance of values. D) Relative expression of SPL genes in SD-grown ML1:amiRTPPJ and 35S:TPPJ at 40 DAG. n = 4 per genotype. Error bars denote Sd; significance calculated based on 1-way ANOVA D) and Student's t-test A); *P < 0.05, **P < 0.01, and ***P < 0.001.
Figure 5.
Figure 5.
WUS activates SPL4 in Arabidopsis. A) Relative expression of mature miRNA and SPL genes in SD-grown Col-0 and clv3-10 apices. n = 4 per genotype. B) Representative pictures of SPL3-5 single, double, and triple CRISPR/Cas9 deletion mutants in comparison to Col-0 grown in SD. Images were digitally extracted for comparison. Scale bar is 1 cm. C) Flowering time of deletion mutants displayed in B) provided as days to bolting and D) total leaf numbers. n = 25 per genotype. The whiskers indicate the highest and lowest values, the box indicates the interquartile range including the upper and lower quartiles, the center line indicates the median, the black dots indicate the mean, and the width indicates the abundance of values. E) Relative expression of mature miRNA and SPL genes in SD-grown Ler-0 and wus-7 apices. n = 3 per genotype. F) Overview of SPL4 5′ regulatory region with putative SPL4WUS sites (indicated as circles) and position of ChIP-PCR amplicons (indicated as boxes below sequence) corresponding to the results shown in G) and H). Boxes marked with I, II, III, and IV (1&2) indicate 5′ SPL4 regions with in total 5 core SPL4WUS sites—I: −1,073 to −1,068 bp, II: −880 to −875 bp, III: −697 to −691, IV1: −259 to −252, and IV2: −214 to −209 bp. Sequence location and lengths used in B) are indicated with #1 to 3. G) Protoplast transactivation assay showing activation of the reporter (LUC) when coupled to the regions indicated in F), relative to REN activity. c indicates the vector control. n = 3. H) Enrichment of Regions I, II, III, and IV1&2 as indicated in F) measured by ChIP–PCR relative to the input in clv3–7 and clv3-10 apices. n = 3. LUC, luciferase; PB, postbinding fraction; REN, renilla. Error bars denote Sd; significance calculated based on 1-way ANOVA A, E) and Student's t-test D, G); *P < 0.05, **P < 0.01, and ***P < 0.001.
Figure 6.
Figure 6.
A negative feedback regulation between WUS and SPL4 in Arabidopsis. A) Overview of WUS 5′ regulatory region with putative WUSSPL site corresponding to the results shown in B to D). Gray box indicates 5′ WUS region with the native and mutated core WUSSPL site −1,067/−1,063 bp (indicated as circles). Sequence location and lengths used in B, C) indicated as lines below. B, C) Protoplast transactivation assay showing repression of the reporter (LUC) when coupled to the 5′WUS region indicated in A), B) relative to REN activity of the native 5′WUS, and C) the comparison of the native and the mutated WUSSPL site, n = 3. D) EMSA for SPL4 binding to the WUSSPL site A). Shifted band in the presence of SPL4 protein (open arrowhead) and nonshifted fraction (closed arrowhead). Please note the shift in the presence of the mutated competitor (+*), indicating specificity of binding. LUC, luciferase; REN, renilla. Error bars denote Sd; significance calculated based on 1-way ANOVA; **P < 0.01 and ***P < 0.001.
Figure 7.
Figure 7.
Dynamic regulations between sugar signaling, meristem maintenance, and the flowering network at the Arabidopsis SAM. A) Timing of SAM morphology throughout the floral transition. B) 1: Sugar C) signaling through the T6P pathway plays a central role in the induction of flowering in leaves via FT (downstream of the photoperiod pathway), but also at the SAM. 2: During vegetative development, SAM maintenance is controlled by WUS and CLV3 in a negative feedback loop. At floral transition, increased sucrose flux to the SAM and activity of the T6P pathway uncouples this regulation apart from its effect on the miR156/SPL module (age pathway). 3: This results in a spatial relocation of the WUS expression domain and doming and induces SOC1 (floral integrator network). 4: WUS induces SPL4 in the SAM center, which in turn represses WUS constituting a transient negative feedback loop. This allows the system to swing back, supported by WUS directly inducing TPPJ in the outer SAM layers. C) Impact of the T6P pathway on growth. leaf primordium (lp), flower primordium (fp), vegetative (V), transition (T), and inflorescence (I) SAM, florigen activation complex (FAC).

References

    1. Baena-González E, Lunn JE. SnRK1 and trehalose 6-phosphate—two ancient pathways converge to regulate plant metabolism and growth. Curr Opin Plant Biol. 2020:55:52–59. 10.1016/j.pbi.2020.01.010 - DOI - PubMed
    1. Baurle I, Laux T. Regulation of WUSCHEL transcription in the stem cell niche of the Arabidopsis shoot meristem. Plant Cell. 2005:17(8):2271–2280. 10.1105/tpc.105.032623 - DOI - PMC - PubMed
    1. Bernier G. The control of floral evocation and morphogenesis. Annu Rev Plant Physiol Plant Mol Biol. 1998:39(1):175–219. 10.1146/annurev.pp.39.060188.001135 - DOI
    1. Bertran Garcia de Olalla E, Cerise M, Rodriguez-Maroto G, Casanova-Ferrer P, Vayssieres A, Severing E, Lopez Sampere Y, Wang K, Schafer S, Formosa-Jordan P, et al. Coordination of shoot apical meristem shape and identity by APETALA2 during floral transition in Arabidopsis. Nat Commun. 2024:15(1):6930. 10.1038/s41467-024-51341-6 - DOI - PMC - PubMed
    1. Birkenbihl RP, Jach G, Saedler H, Huijser P. Functional dissection of the plant-specific SBP-domain: overlap of the DNA-binding and nuclear localization domains. J Mol Biol. 2005:352(3):585–596. 10.1016/j.jmb.2005.07.013 - DOI - PubMed

MeSH terms

LinkOut - more resources