. 2025 Sep:59:102450.
doi: 10.1016/j.tranon.2025.102450. Epub 2025 Jul 9.

Integrated single-cell sequencing for the development of a GJA4-based precision immuno-prognostic model in melanoma

Affiliations

Integrated single-cell sequencing for the development of a GJA4-based precision immuno-prognostic model in melanoma

Yantao Ding et al. Transl Oncol. 2025 Sep.

Abstract

Methods: We conducted an analysis of RNA-seq and microarray data obtained from the TCGA and GEO databases, alongside single-cell RNA sequencing (scRNA-seq) data from glioma patients within the GEO repository. This comprehensive investigation, augmented by experimental studies, concentrated on exploring the interactions between tumor-associated endothelial cells (TECs) and tumors, as well as elucidating the molecular mechanisms involved.

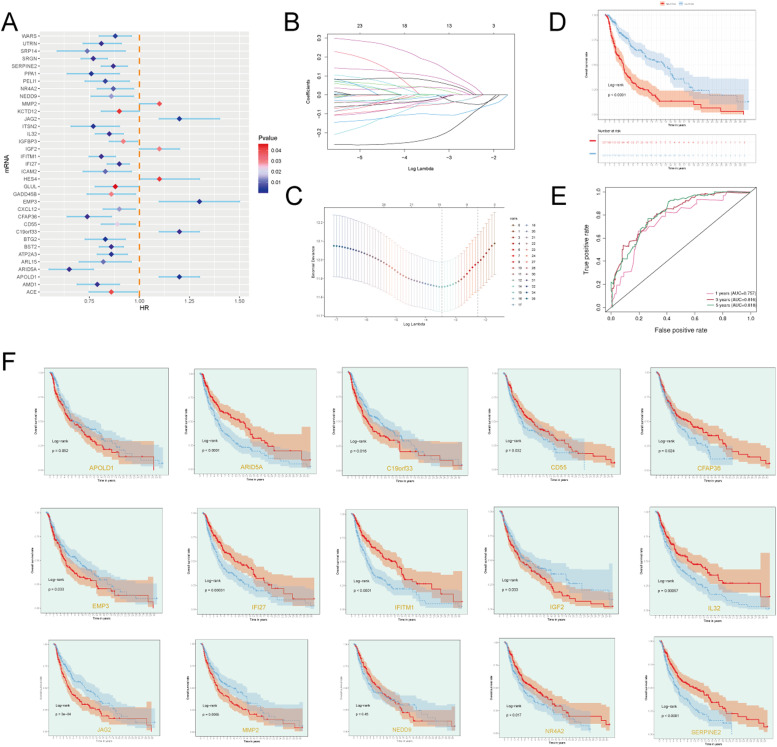
Results: Single-cell sequencing analysis identified differentially expressed genes within tumor-associated endothelial cells. Further investigation highlighted GJA4 as a pivotal marker gene for a terminal subpopulation, with its expression linked to poor prognosis. Subsequent experiments were conducted to explore its underlying functional mechanisms.

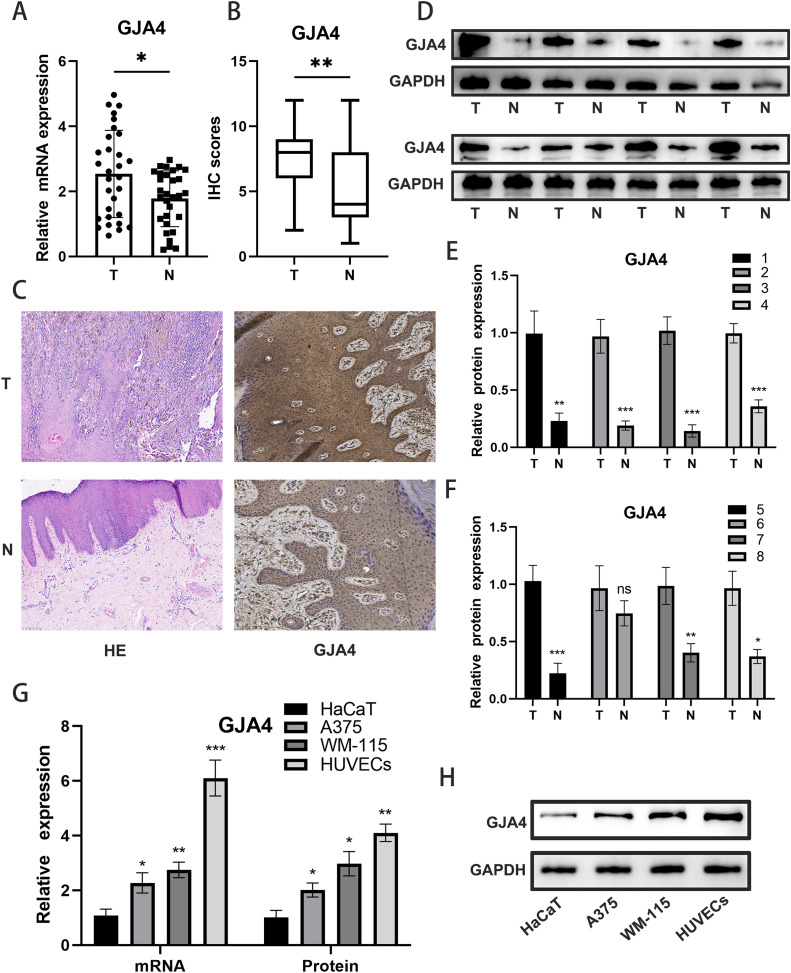
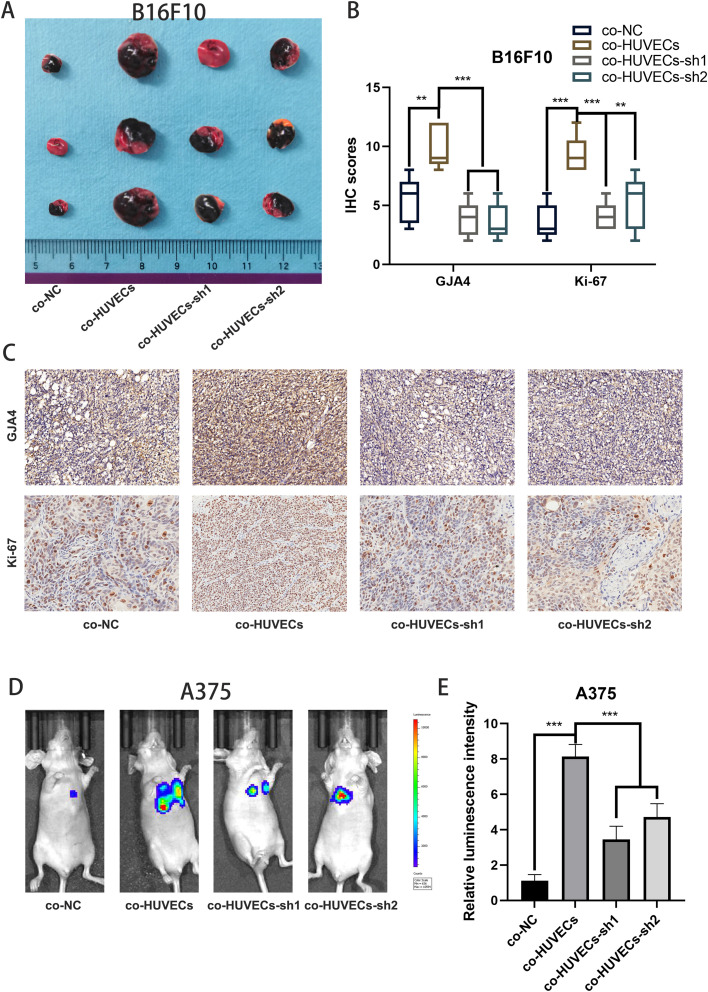
Conclusions: GJA4 is highly expressed in melanoma patients, and its differential expression in tumor-associated endothelial cells influences melanoma proliferation and migration. GJA4-based risk models hold potential as predictive and therapeutic targets for personalized melanoma treatment.

Keywords: Diagnosis; GJA4; Melanoma; Personalized therapy; Prognosis; Tumor-associated endothelial cells.


Conflict of interest statement

Declaration of competing interest All authors declare no potential conflicts of interest.

Figures

Fig. 1:
Fig. 1
Identification of Endothelial Cell Subpopulations in Melanoma A: UMAP visualization showcased the distribution of 1341 endothelial cells divided into four cell subpopulations (top left), the tissue type of endothelial cell subpopulations (top right), cell cycle stages (bottom left), and cell tissue origins (bottom right). B: UMAP visualization exhibited the CNVscore, nCount_RNA, S.score, and G2M.score of 1341 endothelial cells. C: Violin plot displayed the CNVscore of endothelial cell subpopulations categorized by subpopulation type, tissue type origins, and cell cycle stages. D: Bar chart displayed the proportion of the four endothelial cell subpopulations across different sample origins. E: Box plot highlighted the distribution of the four endothelial cell subpopulations among different cell tissue origins. F: Bubble plot showed the differential expression of the top 10 marker genes for endothelial cell subpopulations. The color of the bubbles represented normalized counts, while the size represented the proportion of gene expression. G: Volcano plot presented the expression pattern of differentially expressed genes among the four endothelial cell subpopulations. H: Word cloud displayed the frequency of gene enrichment for different genes among the four endothelial cell subpopulations. I: Heatmap showed the top 5 enriched Gene Ontology Biological Process (GO-BP) terms for differentially expressed genes among the four endothelial cell subpopulations.
Fig. 2:
Fig. 2
Selection of Prognostic-Related Key Genes A: The forest plot displayed the results of univariate Cox analysis, with P ≤ 0.05. The null line represents HR=1, HR<1 indicates a protective factor, and HR>1 indicates a risk factor. B-C: A total of 15 genes, selected through lasso regression, comprised the risk score. The lambda plot demonstrated this result (lambda.min=0.032). D: Kaplan-Meier survival curves illustrated the survival differences between High C2 Score and Low C2 Score groups. E: The ROC curve graph presented the AUC scores for 1 year, 3 years, and 5 years (1 year=0.757, 3 years=0.816, 5 years=0.818). F: Survival curves based on each modeling gene were shown (red denotes high expression group, blue denotes low expression group). Fig. 7: Identification and Analysis of Related Genes for C2 GJA4+ Endothelial Cells A: The curve plot depicted the hazard scores for High C2 Score and Low C2 Score groups (top), the scatter plot displayed the events of survival/death over time for High C2 Score and Low C2 Score (middle), and the heatmap demonstrated the differential gene expression between High C2 Score and Low C2 Score, with color scale based on standardized data (bottom). Blue represented the low-risk score group, while red represented the high-risk score group. B: The correlation of four genes with C2 Score. C19orf33, EMP3, APOLD1, and JAG2 exhibited a positive correlation with Risk. C: Peak plots and box plots showcased the expression differences of the four genes between High C2 Score and Low C2 Score groups. D-E: Scatter plots displayed the correlation analysis between the four genes and overall survival (OS) and the correlation analysis among the four genes. F: Box plots demonstrated the differential expression of the four genes between High C2 Score and Low C2 Score groups, as well as across different age groups (elderly and young), various ethnicities (Asian, Black, or Caucasian), and different TNM stages (T0, T1, T2, T3, T4, Ti; N0, N1, N2, N3, M0, M1). *p ≤ 0.05, **p < 0.01, ***p < 0.001 indicated significant differences, and "ns" indicated no significant difference.
Fig. 3:
Fig. 3
Identification and Analysis of Related Genes for C2 GJA4+ Endothelial Cells A: The curve plot depicted the hazard scores for High C2 Score and Low C2 Score groups (top), the scatter plot displayed the events of survival/death over time for High C2 Score and Low C2 Score (middle), and the heatmap demonstrated the differential gene expression between High C2 Score and Low C2 Score, with color scale based on standardized data (bottom). Blue represented the low-risk score group, while red represented the high-risk score group. B: The correlation of four genes with C2 Score. C19orf33, EMP3, APOLD1, and JAG2 exhibited a positive correlation with Risk. C: Peak plots and box plots showcased the expression differences of the four genes between High C2 Score and Low C2 Score groups. d-E: Scatter plots displayed the correlation analysis between the four genes and overall survival (OS) and the correlation analysis among the four genes. F: Box plots demonstrated the differential expression of the four genes between High C2 Score and Low C2 Score groups, as well as across different age groups (elderly and young), various ethnicities (Asian, Black, or Caucasian), and different TNM stages (T0, T1, T2, T3, T4, Ti; N0, N1, N2, N3, M0, M1). *p ≤ 0.05, **p < 0.01, ***p < 0.001 indicated significant differences, and "ns" indicated no significant difference.
Fig. 4:
Fig. 4
Analysis of Immune Infiltration Differences between High C2 Score and Low C2 Score A: The heatmap displayed the immune cell infiltration profiles for High C2 Score and Low C2 Score groups. Colors represented different cell types. B-C: Box plots illustrated the proportions of immune cell infiltration and the proportions of immune infiltrating cells in High C2 Score and Low C2 Score. The box plot showed the median (line within the box), upper and lower quartiles (box), and data range. D: Box plots demonstrated the differences in StroalScore, ImmuneScore, and ESTIMATEScore between High C2 Score and Low C2 Score. The box plot presented the median (line within the box), upper and lower quartiles (box), and data range. *p ≤ 0.05, **p < 0.01, ***p < 0.001 indicated significant differences, and "ns" indicated no significant difference. E: Box plots and violin plots showcased the differences in tumor purity between High C2 Score and Low C2 Score. *p ≤ 0.05, **p < 0.01, ***p < 0.001 indicated significant differences, and "ns" indicated no significant difference. F: The heatmap demonstrated the differences in RiskScore, mRNA, estimate, cibersort, and xCell between High C2 Score and Low C2 Score. The color scale was based on standardized data. G: Bar plots presented the correlation analysis between immune cells and the constituent scoring genes and C2 Score. The color of the dots represented the magnitude of the p-value, and the size of the dots represented the correlation strength. *p ≤ 0.05, **p < 0.01, ***p < 0.001 indicated significant differences, and "ns" indicated no significant difference. H: The heatmap displayed the correlation analysis results between immune cells and the modeling genes, High C2 Score, Low C2 Score, and overall survival (OS).
Fig. 5:
Fig. 5
Enrichment Analysis of Melanoma Endothelial Cells. A: The volcano plot and heatmap depicted the expression profiles of differentially expressed genes between High C2 Score and Low C2 Score groups. B: The bar graph displayed the results of all enriched analyses for Gene Ontology (GO). C: The KEGG enrich ent analysis of differentially expressed genes demonstrated the enrichment results across different pathways. D: The GSEA enrichment analysis of Gene Ontology Biological Processes (GO-BP) terms for differentially expressed genes revealed the activity of different pathways in different groups.
Fig. 6:
Fig. 6
Analysis of Gene Mutations and Drug Sensitivity in Melanoma Endothelial Cells A: The waterfall plot of gene mutations displayed the mutation patterns of the top 30 genes in 421 individual cells and the mutations of the top 15 constituent modeling genes in 69 samples. The bar graph at the top represented the mutation burden of each sample, while the bar graph on the right represented the overall mutation frequency of the gene in these samples. B: Copy number variations of modeling genes were shown. Blue indicated chromosomal copy number loss, red indicated chromosomal copy number gain, and orange indicated no change in chromosomal copy number. C: The heatmap illustrated the correlation of mutations in the constituent modeling genes. D: The SNP plot visualized the mutation patterns of different genes. E: Box plots and violin plots displayed the differences in tumor mutational burden (TMB) between High C2 Score and Low C2 Score groups. The box plot showed the median (line within the box), upper and lower quartiles (box), and data range. *p ≤ 0.05, **p < 0.01, ***p < 0.001 indicated significant differences, and "ns" indicated no significant difference. F: The scatter plot depicted the correlation analysis between TMB and Risk Score. G: The survival curve presented the survival analysis results for High C2 Score-High TMB, High C2 Score-Low TMB, Low C2 Score-High TMB, and Low C2 Score-Low TMB groups. H: The box plot displayed the differences in drug sensitivity between High C2 Score and Low C2 Score groups. *p ≤ 0.05, **p < 0.01, ***p < 0.001 indicated significant differences, and "ns" indicated no significant difference.
Fig. 7:
Fig. 7
Differential expression of GJA4 in cancerous and adjacent non-cancerous tissues. A: Quantitative analysis of PCR (qPCR): GJA4 mRNA expression in 30 pairs of cancerous and adjacent non-cancerous samples, showing significant upregulation in tumor tissues. B, C:Immunohistochemistry (IHC) analysis of GJA4 expression in paired tissue samples, confirming elevated GJA4 protein levels in tumor tissues. D-F: Western blot analysis of GJA4 protein expression in eight pairs of tissue samples, corroborating the qPCR and IHC findings of increased GJA4 expression in tumor tissues. G-H: RNA and protein expression analysis of GJA4 in HaCaT, A375, WM-1115, and HUVECs cell lines, demonstrating slight upregulation in melanoma cell lines and highest expression in HUVECs cell lines.
Fig. 8:
Fig. 8
Functional validation of GJA4 knockout in HUVECs. A: Relative quantification of angiogenesis assays. B: Relative quantification of WB and q-RT PCR experiment. C: Angiogenesis assays showing that GJA4 knockout significantly inhibits the angiogenic capability of HUVECs. D: Measurement of VEGFA levels and TGF-β signaling pathway activity in HUVECs via WB experiment. E-H: Co-culture experiments with HUVECs and A375 or WM-115 melanoma cell lines, indicating that HUVECs enhance the invasion and metastasis of melanoma cells. This enhancement is significantly inhibited when melanoma cells are co-cultured with GJA4-knockout HUVECs.
Fig. 9:
Fig. 9
In vivo functional validation of GJA4. A: Subcutaneous tumor formation assay with B16F10 cells co-cultured with HUVECs. Tumor volume was significantly increased when B16F10 cells were co-cultured with HUVECs compared to GJA4-knockout HUVECs. B: Relative quantification of immunohistochemical test. C: Representative images of immunohistochemical test. D: Representative images of lung metastasis experiment. E: Relative quantification of lung metastasis experiment.
Fig. 10:
Fig. 10
Exploration of GJA4 and the immune microenvironment. A: mIHC analysis shown that GJA4 expression was significantly higher in CD31-positive areas of tumor tissues compared to normal tissues. Regions with dual positivity for CD31 and GJA4 showed lower levels of CD8+ T cell infiltration. B-C: Relative quantification of mIHC.

References

    1. Carvajal R.D., Sacco J.J., Jager M.J., Eschelman D.J., Olofsson Bagge R., Harbour J.W., Chieng N.D., Patel S.P., Joshua A.M., Piperno-Neumann S. Advances in the clinical management of uveal melanoma. Nat. Rev. Clin. Oncol. 2023;20:99–115. - PubMed
    1. Rantala E.S., Hernberg M.M., Piperno-Neumann S., Grossniklaus H.E., Kivela T.T. Metastatic uveal melanoma: the final frontier. Prog. Retin. Eye Res. 2022;90 - PubMed
    1. Robertson A.G., Shih J., Yau C., Gibb E.A., Oba J., Mungall K.L., Hess J.M., Uzunangelov V., Walter V., Danilova L., et al. Integrative analysis identifies four molecular and clinical subsets in uveal melanoma. Cancer Cell. 2017;32:204–220. e215. - PMC - PubMed
    1. Long G.V., Swetter S.M., Menzies A.M., Gershenwald J.E., Scolyer R.A. Cutaneous melanoma. Lancet. 2023;402:485–502. - PubMed
    1. Manley C., Olszanski A. Melanoma in the bronchus. N. Engl. J. Med. 2018;379:e36. - PubMed

LinkOut - more resources