. 2025 Jul 8;301(8):110465.
doi: 10.1016/j.jbc.2025.110465. Online ahead of print.

Acetylation of microtubule-binding PinX1 orchestrates ribosome biogenesis to nutrient starvation via the RNA polymerase I preinitiation complex

Affiliations

Acetylation of microtubule-binding PinX1 orchestrates ribosome biogenesis to nutrient starvation via the RNA polymerase I preinitiation complex

Gang Lu et al. J Biol Chem. .

Abstract

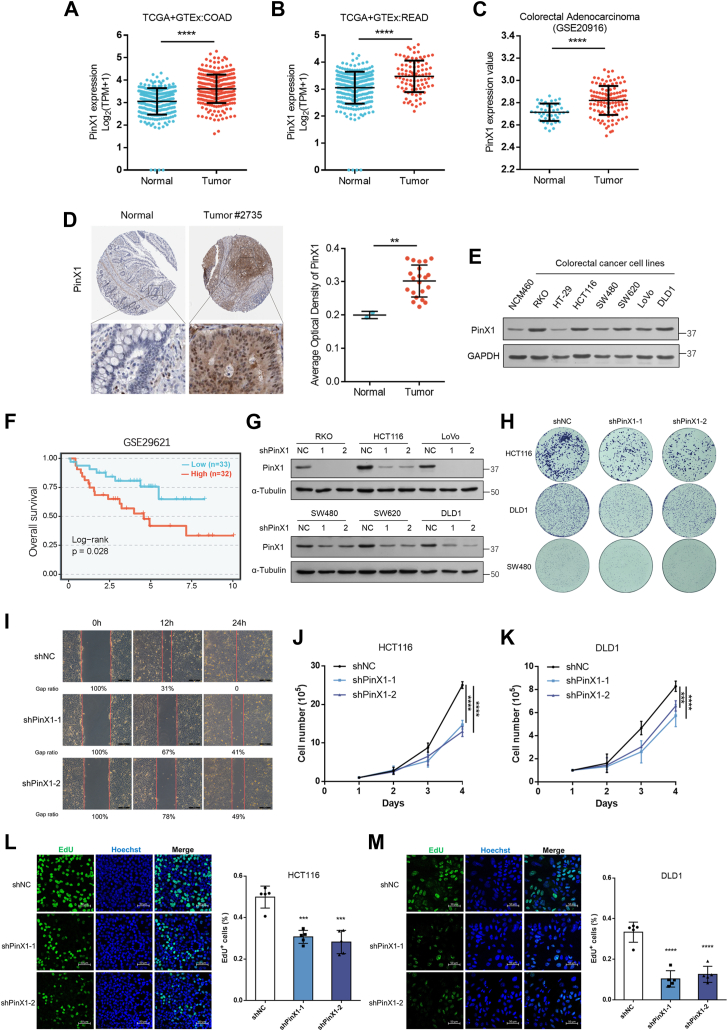
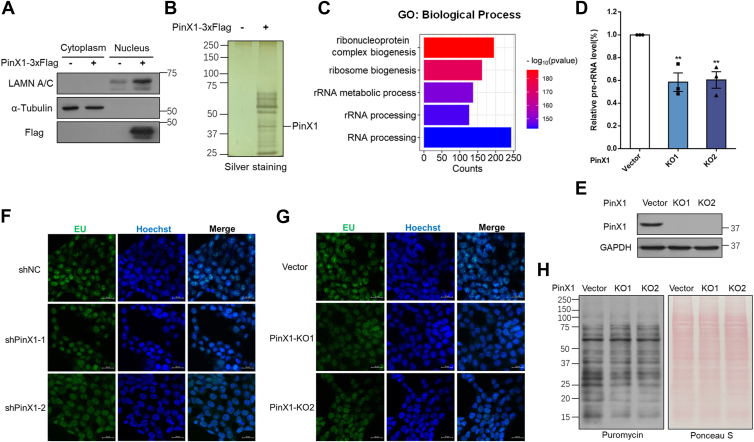
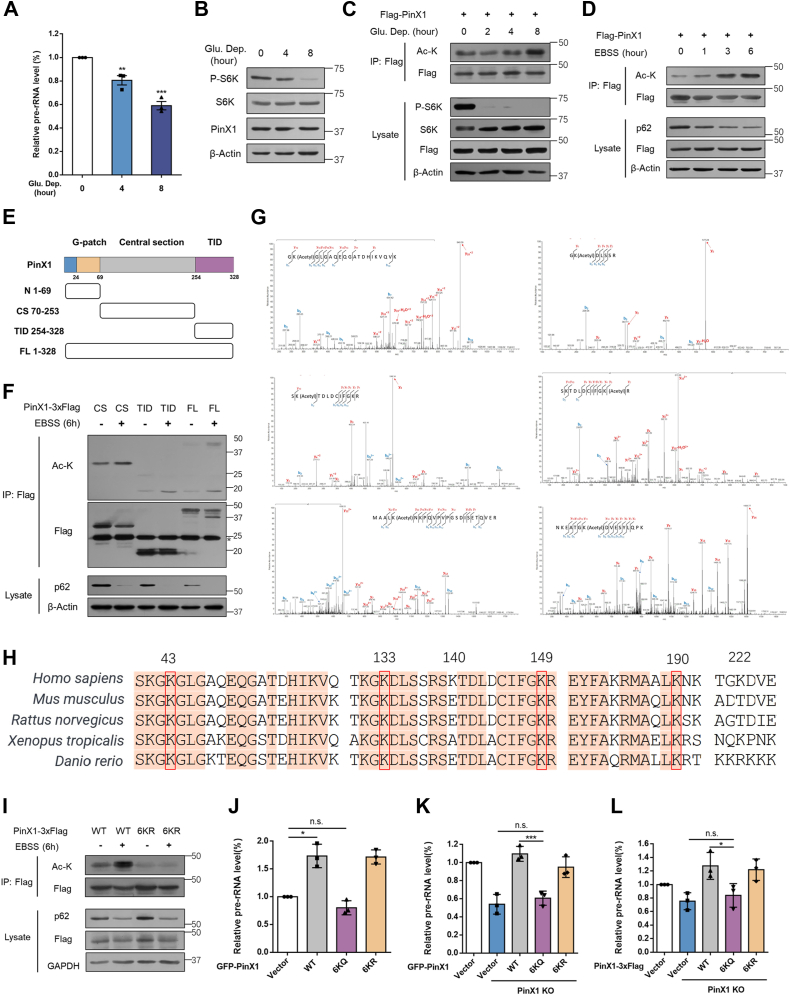
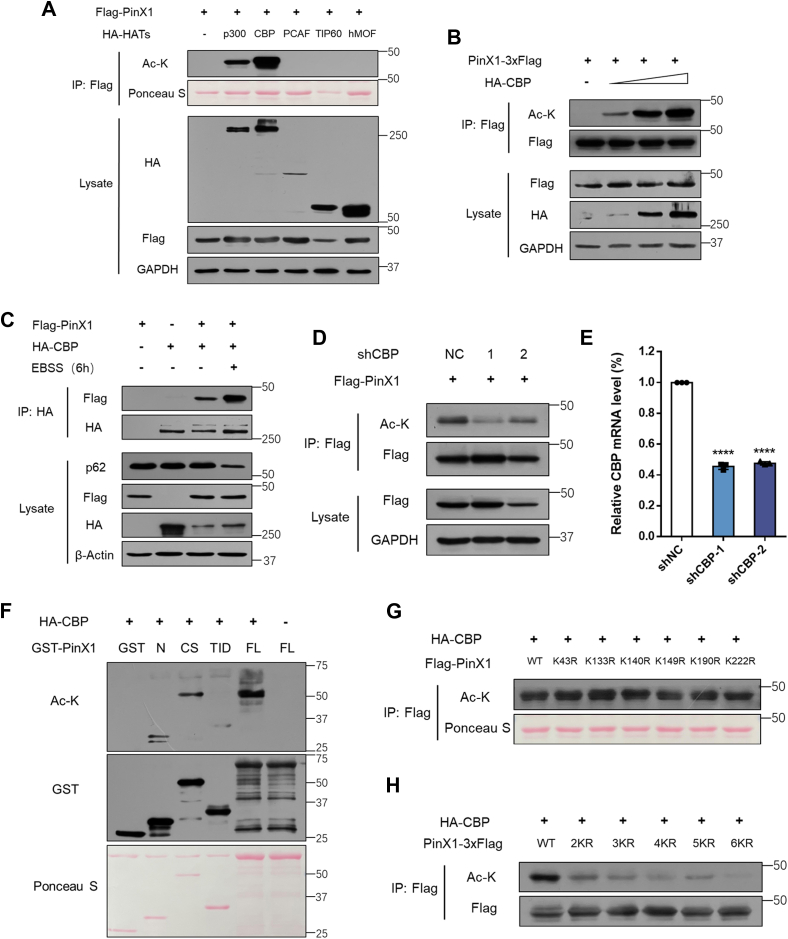
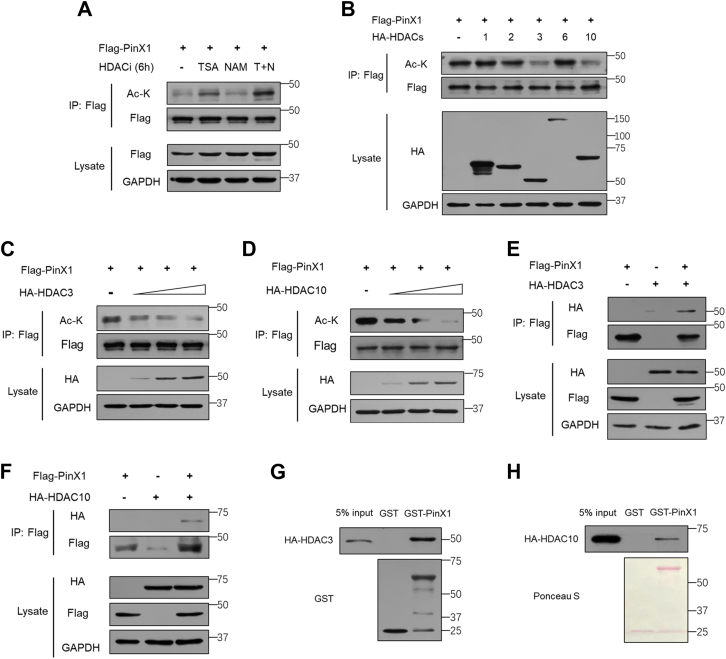
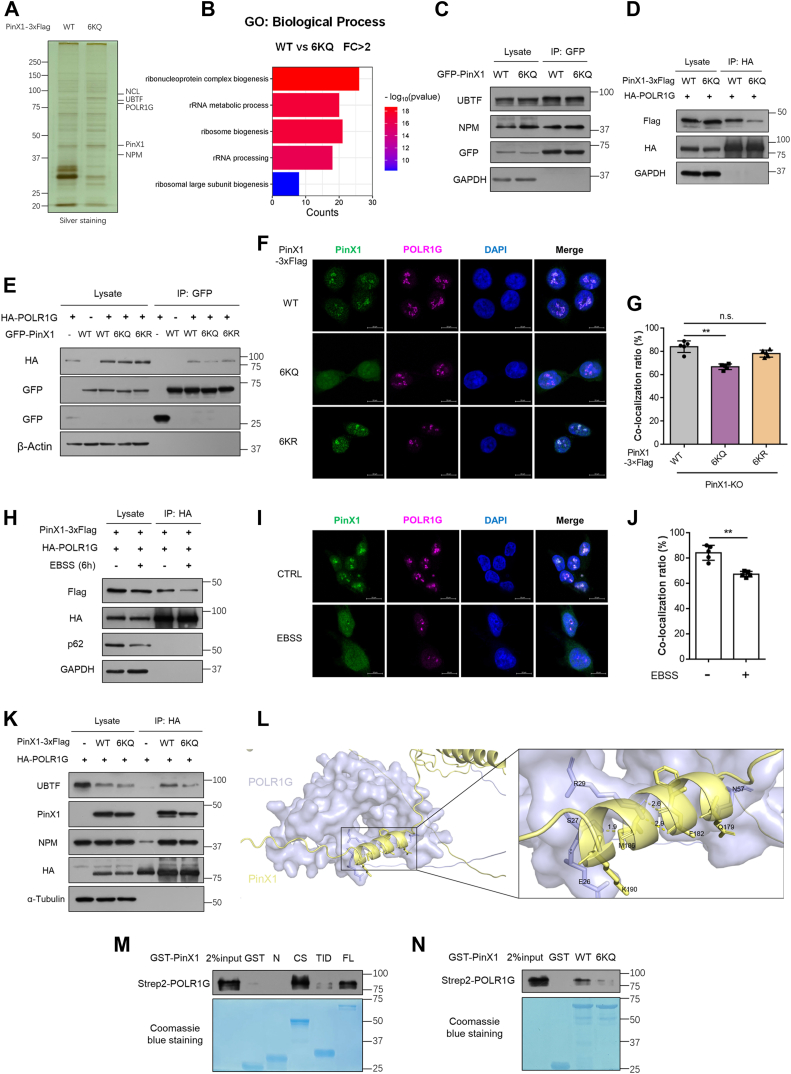
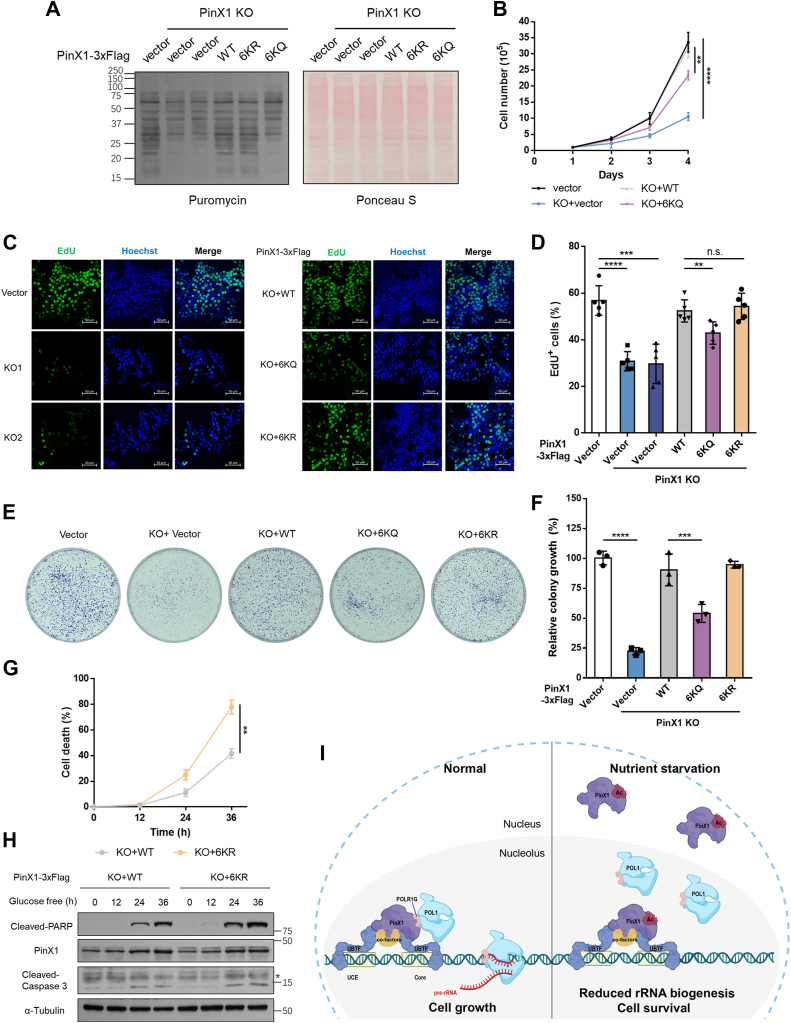
The shutdown of ribosome biogenesis is one of the sophisticated strategies for cells to save energy in response to nutrient starvation. However, the mechanism orchestrating ribosome biogenesis with cellular nutrition status remains unclear. Here, we identified the role of PIN2/TRF1-interacting telomerase inhibitor 1 (PinX1) in regulating ribosome biogenesis. PinX1 is highly expressed in colorectal cancers (CRC). Depletion of PinX1 impairs rDNA transcription, compromises ribosome biogenesis and inhibits tumor cells proliferation. Mechanically, associated with UBTF, PinX1 directly binds to RNA polymerase I subunit G (POLR1G) which is required for the assembly of RNA polymerase I preinitiation complex (PIC). Upon nutrient starvation, PinX1 is acetylated at K43, K133, K140, K149, K190, K222, which hinders its binding to POLR1G leading to disassembly of PIC. Collectively, our findings uncover a novel role of PinX1 and its acetylation, fine-tuning nucleolar transcription to stress signaling.

Keywords: POLR1G; PinX1; post-translational modification (PTM); ribosome biogenesis.


Conflict of interest statement

Conflict of interest The authors declare that they have no conflicts of interest with the contents of this article.

Figures

Figure 1
Figure 1
PinX1 is overexpressed in CRC cells and promotes cell proliferation.A and B, Scatter plots of PinX1 expression levels of normal tissues and tumor tissues in colon adenocarcinoma (COAD, left) and rectum adenocarcinoma (READ, right) from TCGA and GTEx database. C, Scatter plots of PinX1 expression values of normal tissues and tumor tissues in colorectal adenocarcinoma from GEO database (GSE20916). Data were analyzed using two-tailed unpaired Student’s t test. Error bars indicate the mean ± SD. ∗∗∗∗p < 0.0001. D, IHC staining of PinX1 in normal colon (n = 2) and CRC tissues (n = 21) from HPA database. Average optical density data were analyzed using Mann–Whitney U test. Error bars indicate the mean ± SD. ∗∗p < 0.01. E, Western blot analysis of PinX1 protein levels comparing one normal colon epithelial cell line with seven CRC cell lines. F, Kaplan–Meier plots of colon cancer patients stratified by PinX1 mRNA levels from BEST web application, based on the GEO database (GSE29621). G, Validation of the knock-down efficiency of PinX1 in CRC cells infected with lentivirus carrying shRNA or PLKO.1 vector using western blotting. H, wild-type and PinX1 knockdown cells as indicated were seeded into 6-well plates at 2 × 10³ per well, and the cell colonies were stained with crystal violet after 7 days. I, wound-healing assays were performed in DLD1 cells (WT, shPinX1-1 or shPinX1-2). Images were captured at times 0, 12, and 24 h. Scale bars = 100 μm. J and K, wild-type and PinX1 knockdown cells were seeded into 6-well plates at 105 cells per well, and the cell numbers were counted every day. L and M, the representative image of EdU incorporation assay in wild-type and PinX1 knockdown HCT116 and DLD1 cells (left), Scale bars = 50 μm. The percentage of cells positively stained with EdU was quantified (right) using one-way ANOVA. Error bars indicate the mean ± SD (n = 5). ∗∗∗p < 0.001, ∗∗∗∗p < 0.0001.
Figure 2
Figure 2
PinX1 is required for rDNA transcription and ribosome biogenesis.A, validation of the nuclear and cytoplasmic fraction by western blotting. B, nuclear fraction was immunopurified with anti-Flag agarose beads. The elution was then subjected to SDS–PAGE and silver staining. C, the bar graph shows the enrichment analysis of PinX1-associated proteins in the terms of GO biological process. D, cellular 47S rRNA (pre-rRNA) levels were measured as indicated by real-time PCR and normalized to ACTB mRNA. Error bars indicate mean ± SD of triplicate experiments. ∗∗p < 0.01. E, validation of the knockout efficiency of PinX1 in HCT116 using western blotting. F and G, cells were pulsed with 5-ethynyl uridine (EU) for 10 min, and de novo synthesized RNA (green) was visualized as described against a Hoechst (blue) background. Scale bar = 20 μm. H, PinX1 wild type and PinX1-KO HCT116 cells were pulse treated with puromycin (10 mg/ml, 30 min) before harvest. Lysates were analyzed by Western blotting. Ponceau S staining was used as the loading control.
Figure 3
Figure 3
Nutrient starvation-induced acetylation of PinX1 inhibits rDNA transcription. A, HCT116 cells were cultured in glucose-free medium for the indicated amounts of time (hours). The cells were harvested and pre-rRNA levels were determined by RT-qPCR. Data were analyzed by one-way ANOVA. Error bars indicate the mean ± SD (n = 3). ∗∗p < 0.01, ∗∗∗p < 0.001. B, HCT116 cells were harvested and total proteins were subjected to Western blot for evaluating the indicated proteins. C and D, HCT116 cells were transfected with Flag-PinX1 plasmid and treated with the indicated time of glucose free medium (left) or EBSS medium (right). Whole cell lysates were prepared for immunoprecipitation and acetylation of PinX1 was detected by pan-acetyl-lysine antibody. E, the schematic diagram represents the PinX1 deletion mutant constructs. F, HCT116 cells were transfected with 3×Flag C-terminal-tagged PinX1 deletion mutant plasmids and treated with the indicated time of EBSS medium. The asterisk points to the light chain of igG. G, anti-Flag immunoprecipitations were performed with the whole cell lysates derived from four 10 cm dishes of HCT116 cells with or without EBSS medium for 6 h. After SDS-PAGE gel separating and Coomassie blue staining, the specific band for PinX1-3×Flag was analyzed by mass spectrometry. The MS/MS spectrums of modified K133, K140, K149, K190, K222 are shown respectively. H, the sequences of PinX1 in different species were aligned. The evolutionarily conserved sequences and lysine residues were highlighted. I, HCT116 cells were transfected with PinX1-3×Flag WT or 6KR mutant plasmids and treated with the indicated time of EBSS medium. J, pre-rRNA levels were determined by RT-qPCR in HT-1080 cells transiently expressing GFP-PinX1 WT, 6KR or 6KQ. (n = 3). K, pre-rRNA levels were determined by RT-qPCR in PinX1 WT, PinX1 KO, PinX1-KO HCT116 cells transiently expressing GFP tagged PinX1 WT, 6KR or 6KQ for 48h. (n = 3). L, pre-rRNA levels were determined by RT-qPCR in PinX1 WT, PinX1 KO, PinX1-KO HCT116 cells stably expressing PinX1 WT, 6KR or 6KQ. qPCR data were analyzed using one-way ANOVA. Error bars indicate the mean ± SD (n = 3). ∗p < 0.05, ∗∗∗p < 0.001, n.s. not significant.
Figure 4
Figure 4
CBP/p300 acetylate PinX1 upon nutrient starvation. A, HEK293T cells were transfected with plasmids as indicated, and the acetylation of PinX1 was detected. B, HEK293T cells were transfected PinX1-3×Flag plasmids together with different amount of HA-CBP, and acetylation of PinX1 was detected. C, HCT116 cells were transfected with plasmids as indicated with or without EBSS treatment, and the protein was extracted for co-IP to determine the interaction between PinX1 and CBP. D and E, HCT116 cells were infected by shCBP lentivirus for 48 h and mixture cells were selected by 1 mg/ml puromycin for 1 week. Acetylation levels of PinX1 were detected and total RNA was subjected to RT-qPCR for evaluation of the mRNA levels of CBP. Error bars indicate the mean ± SD (n = 3). ∗∗∗∗p < 0.0001. F, GST, GST-PinX1 full-length (FL), and three GST-PinX1 deletion fragments were purified from bacteria transformed with plasmids as indicated. HA-CBP was purified from HEK293T cells transfected with HA-tagged CBP plasmids for 48 h. In vitro acetylation assay was performed. GST protein was used as a negative control. G and H, HEK293T cells were transfected with plasmids as indicated for 24 h. Whole-cell lysates were immunoprecipitated with anti-Flag antibody resin and acetylation of PinX1 was detected. 2KR (K43R, K133R), 3KR (K43R, K133R, K190R), 4KR (K43R, K133R, K190R, K222R), 5KR (K43R, K133R, K140R, K190R, K222R), 6KR (K43R, K133R, K140R, K149R, K190R, K222R). HA, hemagglutinin; HAT, histone acetyltransferase.
Figure 5
Figure 5
HDAC3 and HDAC10 deacetylate PinX1. A, HCT116 cells transfected with Flag-PinX1 were treated with TSA (1 mM) or NAM (10 mM) for 6 h before harvest. B, HEK293T cells were transfected with plasmids as indicated. PinX1 protein was purified and immunoblotted by pan-acetyl-lysine antibody. C and D, Flag-tagged PinX1 was co-transfected with different amounts of HA-tagged HDAC3 or HDAC10 in HEK293T cells. E and F, HEK293T cells were transfected with plasmids as indicated, and the protein was extracted for co-IP to detect the interaction between PinX1 and HDAC3 or HDAC10. G and H, GST pull-down assay was performed as indicated. GST-PinX1 bound HA-HDAC3 or HA-HDAC10 was evaluated by Western blot using an anti-HA antibody.
Figure 6
Figure 6
PinX1 interacts with POLR1G and is required for the assembly of Pol I preinitiation complex. A, HCT116 cells were transfected with 3 × Flag tagged PinX1 WT or 6KQ mutant plasmids. After 48 h, the cells were harvested, and whole cell extracts were immunoprecipitated with an anti-Flag antibody affinity resin. PinX1 and its interacting proteins were eluted by SDS-PAGE, detected by silver and analyzed by mass spectrometry. B, the bar graph shows the enrichment analysis of PinX1-assocaited proteins in the terms of GO biological process. FC, fold change. C, HEK293T cells were transfected with GFP tagged PinX1 WT or 6KQ plasmids, and the proteins were extracted for co-IP to detect the interaction with endogenous UBTF and NPM, which were from mass spectrometry results. D and E, HEK293T cells were transfected as indicated, and the protein was extracted for co-IP to detect the interaction of PinX1 and POLR1G. F, PinX1 WT, 6KR, 6KQ rescued HCT116 cells were stained with PinX1 antibody (green) and POLR1G antibody (magenta). DAPI (blue), nucleus. Scale bar = 10 μm. G, the quantification of co-localization ratio of PinX1 and POLR1G, related to (F). The data was represented by mean ± SD (n = 5). ∗∗p < 0.01. H, HCT116 cells were transfected with PinX1-3 × Flag and HA-POLR1G plasmid and treated with the indicated time of EBSS medium. The protein was extracted for co-IP to detect the interaction between PinX1 and POLR1G. I, HCT116 cells were treated with or without EBSS medium and stained with PinX1 antibody (green) and POLR1G antibody (magenta). DAPI (blue), nucleus. Scale bar = 10 μm. J, the quantification of co-localization ratio of PinX1 and POLR1G, related to (I). The data was represented by mean ± SD (n = 5). ∗∗p < 0.01. K, HA-POLR1G was transfected into PinX1 knockout HCT116 cells individually or together with PinX1 WT or 6KQ. The protein was extracted for co-IP to detect the interaction between POLR1G and other components among PIC. L, the predicted structure of human PinX1 and POLR1G from the AlphaFold2 database (identifier: AF-Q96BK5-F1, AF-O15446-F1) and docking model was visualized in PyMOL. M, GST pull-down assay was performed as indicated. GST-PinX1 truncation bound Strep2-POLR1G was evaluated by Western blot using an anti-POLR1G antibody. N, GST-PinX1 6KQ bound Strep2-POLR1G was evaluated.
Figure 7
Figure 7
Hyperacetylated PinX1 represses protein synthesis and cell proliferation.A, PinX1 wild type, PinX1 KO and rescued HCT116 cells were pulse treated with puromycin (10 mg/ml, 30 min) before harvest. Lysates were analyzed by Western blotting. Ponceau S staining was used as the loading control. B, wild-type, PinX1 KO or PinX1 rescued HCT116 cells were seeded into 6-well plates at 105 cells per well and the cell numbers were counted every day. C, the representative image of EdU incorporation assay in wild type, PinX1 KO and rescued HCT116 cells. Scale bars = 50 μm. D, the percentage of cells positively stained with EdU was quantified. Five fields of cells for each sample were counted and analyzed using one-way ANOVA. Data are shown as mean ± SD (n = 5). ∗∗p < 0.01, ∗∗∗∗p < 0.0001, n.s. not significant. E, wild-type, PinX1 knockout, or rescued HCT116 cells as indicated were seeded into 6 cm dishes at 5000 per dish, and the cell colonies were stained with crystal violet after 7 days. F, colony numbers were quantitated. Data are shown as mean ± SD of triplicate experiments. ∗∗∗p < 0.001, ∗∗∗∗p < 0.0001. G, PinX1 WT or 6KR rescued HCT116 cells were cultured in glucose free medium for the indicated time (hours), followed by cell viability analyses using PI uptake assay. The percentage of cells positively stained with PI was quantified using unpaired t test. Data are shown as mean ± SD (n = 3), with ∗∗p < 0.01. H, the levels of proteins were determined by Western blotting as indicated. The asterisk points to a nonspecific band. I, working model illustrates that acetylation of PinX1 regulates rDNA transcription by impairing the interaction of POLR1G with UBTF.

Similar articles

References

    1. Liu X., Cai S., Zhang C., Liu Z., Luo J., Xing B., et al. Deacetylation of NAT10 by Sirt1 promotes the transition from rRNA biogenesis to autophagy upon energy stress. Nucleic Acids Res. 2018;46:9601–9616. - PMC - PubMed
    1. Park J.-M., Lee D.-H., Kim D.-H. Redefining the role of AMPK in autophagy and the energy stress response. Nat. Commun. 2023;14:2994. - PMC - PubMed
    1. Huang Y., Meng F., Zeng T., Thorne R.F., He L., Zha Q., et al. IFRD1 promotes tumor cells “low-cost” survival under glutamine starvation via inhibiting histone H1.0 nucleophagy. Cell Discov. 2024;10:57. - PMC - PubMed
    1. Shi L., Tu B.P. Acetyl-CoA and the regulation of metabolism: mechanisms and consequences. Curr. Opin. Cell Biol. 2015;33:125–131. - PMC - PubMed
    1. Mariño G., Pietrocola F., Eisenberg T., Kong Y., Malik S.A., Andryushkova A., et al. Regulation of autophagy by cytosolic acetyl-coenzyme A. Mol. Cell. 2014;53:710–725. - PubMed

LinkOut - more resources