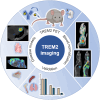
Image-Derived Blood Normalization of Antibody-Based TREM2 PET in Mouse Models of Amyloidosis and Myocardial Infarction
- PMID: 40639905
- PMCID: PMC12410300
- DOI: 10.2967/jnumed.125.269472
Image-Derived Blood Normalization of Antibody-Based TREM2 PET in Mouse Models of Amyloidosis and Myocardial Infarction
Abstract
The triggering receptor expressed on myeloid cells 2 (TREM2) plays a pivotal role in the activation of myeloid cells and is currently being investigated as a potential therapeutic target in several diseases. In this study, we established enhanced quantification of PET images of a 64Cu-labeled antibody-based PET radiotracer as a noninvasive tool for the assessment of TREM2 expression in the brain and peripheral organs of mice. We used TREM2 knockout mice that lack target expression to investigate data-driven blood normalization of PET images against percentage of injected dose normalization. Methods: TREM2 knockout and wild-type mice (n = 11 each) were injected with the radiotracer [64Cu]Cu-NODAGA-ATV:4D9 (ATV is antibody transport vehicle). Twenty hours after injection, TREM2 PET was conducted and blood samples were collected. A voxelwise analysis with statistical parametric mapping served to determine voxels that correlate with ex vivo blood radioactivity levels. Furthermore, TREM2 PET signals were compared between mice with and those without TREM2 expression using image-derived blood normalization. Correlation with TREM2 protein expression levels in the lung, liver, spleen, and bone marrow was used to validate organ-specific PET results. Disease models of brain amyloidosis and myocardial infarction were investigated to test for the value of image-derived normalization in mice. Results: Blood radioactivity levels derived from a statistical parametric mapping-derived region of interest demonstrated a robust correlation with radioactivity measurements obtained from ex vivo blood samples. Voxelwise clusters of TREM2 PET signals were more robustly detected after blood normalization of the PET images. Significant voxelwise clusters of TREM2 PET signals in peripheral organs correlated with TREM2 protein expression levels. Furthermore, image-derived normalization enhanced the significance of voxelwise clusters of TREM2 in the brains of App SAA;TfRmu/hu mice, as well as the TREM2 signal in the myocardial infarct region. Both strongly correlated with ex vivo autoradiography. Conclusion: Normalization of PET images to account for blood levels enhanced the detection of TREM2. This improved methodology for TREM2 PET analysis provides a promising basis for future assessments of TREM2 imaging.
Keywords: 64Cu; ATV:4D9; PET; SPM; TREM2.
© 2025 by the Society of Nuclear Medicine and Molecular Imaging.
Figures


Similar articles
-
PET imaging of microglia in Alzheimer's disease using copper-64 labeled TREM2 antibodies.Theranostics. 2024 Sep 30;14(16):6319-6336. doi: 10.7150/thno.97149. eCollection 2024. Theranostics. 2024. PMID: 39431020 Free PMC article.
-
PET imaging of TREM2 in amyloid-beta induced neuroinflammation.Eur J Nucl Med Mol Imaging. 2025 Sep;52(11):4320-4333. doi: 10.1007/s00259-025-07358-0. Epub 2025 May 28. Eur J Nucl Med Mol Imaging. 2025. PMID: 40434494 Free PMC article.
-
Endoplasmic Reticulum Stress-Induced triggering Receptor Expressed on Myeloid Cells 2 (TREM2) Downregulation Exacerbates Platelet Activation and Myocardial Infarction in Patients With Coronary Artery Disease.J Am Heart Assoc. 2025 Jul;14(13):e041220. doi: 10.1161/JAHA.124.041220. Epub 2025 Jun 23. J Am Heart Assoc. 2025. PMID: 40551335
-
PET-CT for assessing mediastinal lymph node involvement in patients with suspected resectable non-small cell lung cancer.Cochrane Database Syst Rev. 2014 Nov 13;2014(11):CD009519. doi: 10.1002/14651858.CD009519.pub2. Cochrane Database Syst Rev. 2014. PMID: 25393718 Free PMC article.
-
Positron emission tomography-adapted therapy for first-line treatment in individuals with Hodgkin lymphoma.Cochrane Database Syst Rev. 2015 Jan 9;1(1):CD010533. doi: 10.1002/14651858.CD010533.pub2. Cochrane Database Syst Rev. 2015. Update in: Cochrane Database Syst Rev. 2025 Mar 26;3:CD010533. doi: 10.1002/14651858.CD010533.pub3. PMID: 25572491 Free PMC article. Updated.
References
MeSH terms
Substances
LinkOut - more resources
Full Text Sources
Medical
Research Materials
