. 2025 Jul 10;16(1):6391.
doi: 10.1038/s41467-025-61577-5.

Super-resolution microscopy of mitochondrial mRNAs

Affiliations

Super-resolution microscopy of mitochondrial mRNAs

Stefan Stoldt et al. Nat Commun. .

Abstract

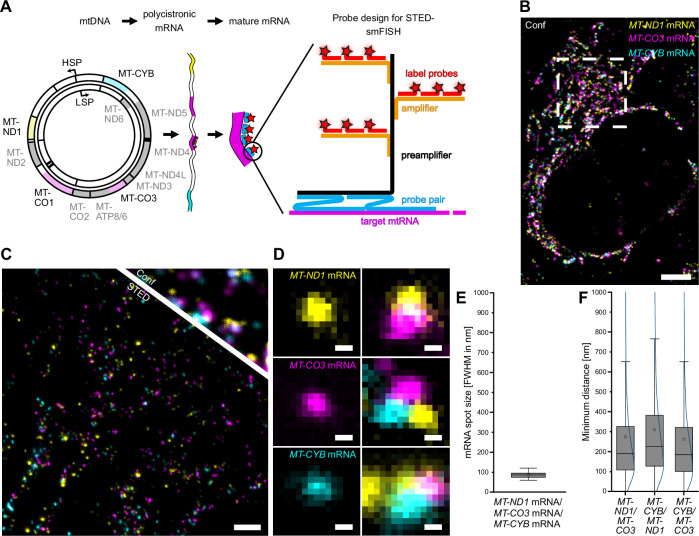
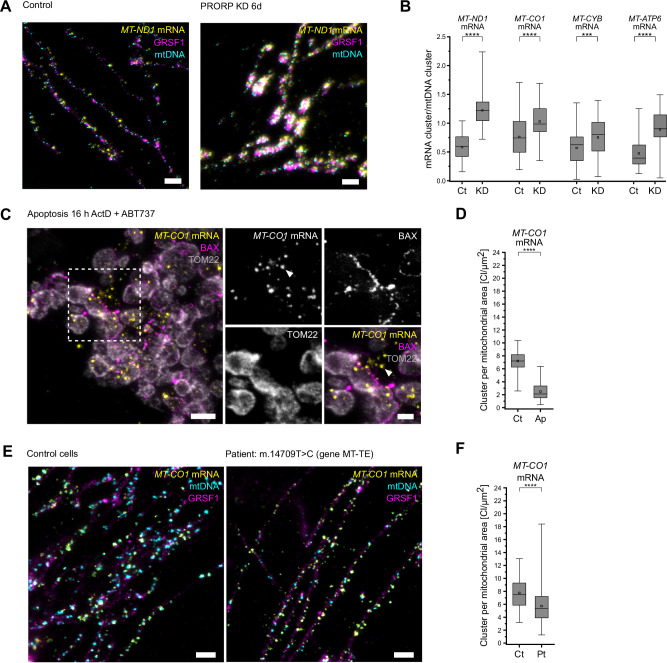
Mitochondria contain their own DNA (mtDNA) and a dedicated gene expression machinery. As the mitochondrial dimensions are close to the diffraction limit of classical light microscopy, the spatial distribution of mitochondrial proteins and in particular of mitochondrial mRNAs remains underexplored. Here, we establish single-molecule fluorescence in situ hybridization (smFISH) combined with STED and MINFLUX super-resolution microscopy (nanoscopy) to visualize individual mitochondrial mRNA molecules and associated proteins. STED nanoscopy reveals the spatial relationships between distinct mRNA species and proteins such as the RNA granule marker GRSF1, demonstrating adaptive changes in mRNA distribution and quantity in challenged mammalian cells and patient-derived cell lines. Notably, STED-smFISH shows the release of mRNAs during apoptosis, while MINFLUX reveals the folding of the mRNAs into variable shapes, as well as their spatial proximity to mitochondrial ribosomes. These protocols are transferable to various cell types and open new avenues for understanding mitochondrial gene regulation in health and disease.


Conflict of interest statement

Competing interests: The authors declare no competing interests.

Figures

Fig. 1
Fig. 1. STED-smFISH probe design and super-resolution imaging of mitochondrial mRNAs.
A Schematic representation of the STED-smFISH probe design and probe binding. From left to right: Both strands of the circular mtDNA are transcribed into polycistronic mRNAs, which are further processed to generate 11 mature mRNAs. The STED-smFISH probes consist of probe pairs (blue) that target a specific mRNA (magenta). Several probe pairs, depending on the length of the transcript, can bind simultaneously. Only when both probes of a pair are bound, the preamplifier (black) can bind. Multiple amplifier strands (orange) then bind to the preamplifier. The probe ‘tree’ is completed by the binding of the label probes (red), which are coupled to the fluorophore of choice (red stars). Specific probe pairs are available for all mRNAs (see Table 1). HSP: heavy strand promoter, LSP: light strand promoter. B Three-color confocal overview image of a U-2 OS cell labeled for the MT-ND1 mRNA (yellow), MT-CO3 mRNA (magenta), and MT-CYB mRNA (cyan). C Comparison between the STED and the confocal image at a higher magnification of the indicated area in (B). D Exemplary close-ups of spatially separated mRNAs (left) and mRNA clusters (right). E Full width half maximum (FWHM) of MT-ND1, MT-CO3, and MT-CYB mRNA spot sizes. N = 3, n = 171, mtRNA spots: 6674. F Quantification of the minimum pairwise distances between MT-ND1, MT-CO3, and MT-CYB mRNAs. N = 3, n = 70. Box: 25/75 percentile; whiskers: max/min without outliers; line: median; square: mean (E, F). Curved line: kernel density estimation representing the data point distribution (F). Source data are provided as a Source Data file. ‘N’ indicates biological replicates; ‘n’ indicates technical replicates. Scale bars: 5 µm (B), 1 µm (C), 50 nm (D).
Fig. 2
Fig. 2. Design of MINFLUX-smFISH probes and 3D nanometer-scale mapping of mitochondrial mRNAs.
A Schematic representation of the MINFLUX-smFISH probe design. MINFLUX-smFISH probes consist of probe pairs (blue) targeting a specific mRNA (magenta). Both probes of a pair must bind to the mRNA in order for the preamplifier (black) to bind. The preamplifier for MINFLUX-smFISH is contiguous with a docking strand for DNA-PAINT (orange). The complementary imager strand (red), which is coupled to a single fluorophore (red star), transiently binds to the docking strand. B 3D rendition of MINFLUX localizations of sequentially acquired MT-ND1 mRNA (yellow), MT-CO1 mRNA (magenta), and MT-CYB mRNAs (cyan) data in a mitochondrial segment (rendered with sphere diameters of 10 nm). C Close-ups of several sites from (B). D Histogram of the distribution of combined localization precisions of MINFLUX data. Dashed lines: median localization precisions. Magenta: axial localization precision (median = 1.1 nm). Cyan: radial localization precision (median = 2.8 nm). E Example close-ups from (B) showing different shapes of MT-CYB mRNA reflected by the fluorophore positions. F Quantification of the minimum pairwise distances between MT-ND1, MT-CO3, and MT-CYB mRNAs. N = 2, n = 4. Box: 25/75 percentile; whiskers: max/min without outliers; line: median; square: mean; curved line: kernel density estimation representing the data point distribution (F). Source data are provided as a Source Data file. ‘N’ indicates biological replicates; ‘n’ indicates technical replicates. Sphere diameter = 10 nm (B, C, E).
Fig. 3
Fig. 3. STED-smFISH to visualize nanoscale changes in mitochondrial mtRNA localizations.
A STED-smFISH of U-2 OS cells: control cells treated with scrambled siRNA and PRORP knockdown (KD) cells, labeled for MT-ND1 mRNA (yellow), GRSF1 (magenta), and mtDNA (cyan). B Quantification of the MT-ND1, MT-CO1, MT-CYB, and MT-ATP6 mRNA cluster to mtDNA cluster (nucleoid) ratio in control cells (Ct) and in PRORP KD cells (KD). N = 3, n(MT-ND1, Ct) = 60, n(MT-ND1, KD) = 62, n(MT-CO1, Ct) = 73, n(MT-CO1, KD) = 73, n(MT-CYB, Ct) = 74, n(MT-CYB, KD) = 73, n(MT-ATP6, Ct) = 73, n(MT-ATP6, KD) = 71; ****: p-value <0.0001, ***: p-value <0.001 . C STED image (overview and magnifications as indicated) of an apoptotic U-2 OS cell (treated with ActD, ABT-737, and Q-VD-OPh for 16 h). Cells were labeled for BAX (magenta), TOM22 (gray), and MT-CO1 mRNA (yellow) and show MT-CO1 mRNA signals outside of the confines of the mitochondrial outer membrane (arrowhead). D Quantification of MT-CO1 mRNA clusters per mitochondrial area in untreated control (Ct) cells and apoptotic (Ap) cells. N = 3, n(Ct) = 74, n(Ap) = 74; p value <0.0001. E STED-smFISH of MT-CO1 mRNA (yellow) together with immunolabeling for GRSF1 (magenta) and mtDNA (cyan) in cultured human fibroblasts, derived from a control (left) and a patient sample (right) carrying the m.14709 T > C mutation in gene MT-TE encoding the tRNA-Glu. F Quantification of MT-CO1 mRNA clusters per mitochondrial area in control fibroblasts (Ct) and fibroblasts from the patient (Pt). N = 3, n(Ct) = 74, n(Pt) = 75; p value <0.0001. Box: 25/75 percentile; whiskers: max/min without outliers; line: median; square: mean; Statistical analysis between two groups (B, D, F) was performed using an unpaired, two-sided Student’s t test. ‘N’ indicates biological replicates; ‘n’ indicates technical replicates. Source data are provided as a Source Data file. Scale bars: 1 µm (A, C overview, E) and 500 nm (C close-ups).

References

    1. Anderson, S. et al. Sequence and organization of the human mitochondrial genome. Nature290, 457–465 (1981). - PubMed
    1. Bogenhagen, D. & Clayton, D. A. The number of mitochondrial deoxyribonucleic acid genomes in mouse L and human HeLa cells. Quantitative isolation of mitochondrial deoxyribonucleic acid. J. Biol. Chem.249, 7991–7995 (1974). - PubMed
    1. Kaufman, B. A. et al. The Mitochondrial Transcription Factor TFAM Coordinates the Assembly of Multiple DNA Molecules into Nucleoid-like Structures. Mol. Biol. Cell18, 3225–3236 (2007). - PMC - PubMed
    1. Kukat, C. et al. Super-resolution microscopy reveals that mammalian mitochondrial nucleoids have a uniform size and frequently contain a single copy of mtDNA. Proc. Natl. Acad. Sci.108, 13534–13539 (2011). - PMC - PubMed
    1. Falkenberg, M., Larsson, N.-G. & Gustafsson, C. M. Replication and Transcription of Human Mitochondrial DNA. Annu. Rev. Biochem.93, 47–77 (2024). - PubMed

LinkOut - more resources