. 2025 Jul 10;16(1):6356.
doi: 10.1038/s41467-025-61497-4.

Synaptic loss pattern is constrained by brain connectome and modulated by phosphorylated tau in Alzheimer's disease

Affiliations

Synaptic loss pattern is constrained by brain connectome and modulated by phosphorylated tau in Alzheimer's disease

Ying Luan et al. Nat Commun. .

Abstract

Synaptic loss strongly correlates with cognitive impairment in Alzheimer's disease (AD), yet the mechanism linking its origin and pattern remain unclear. Given that connected brain regions share molecular and synaptic features, and pathological tau, a key driver of synaptic degeneration, propagates through brain networks, we hypothesize that network architecture may influence synaptic loss in AD. By combining synaptic vesicle glycoprotein 2 A (SV2A) PET in 91 AD patients and 54 controls with normative connectome data, we show strongly connected regions exhibit similar levels of synaptic loss, and synaptic loss in one region is associated with connectivity-weighted synaptic loss in connected regions. Regions strongly connected to the epicenter show greater and faster synaptic loss. Plasma p-tau181 levels correlate with network-constrained synaptic loss, and post-mortem data confirm reduced SV2A expression in tau-rich areas. These findings support that synaptic vulnerability in AD is partially constrained by network topology and is modulated by phosphorylated tau.


Conflict of interest statement

Competing interests: The authors declare no competing interests.

Figures

Fig. 1
Fig. 1. Group-average SV2A-PET SUVR, SV2A-PET w score and annual change rate of SV2A-PET w score.
a Group-average SV2A-PET SUVRs. b Group-average SV2A-PET w scores. c Group-average annual change rates of SV2A-PET w score. The maps are rendered on cortical surfaces, stratified by diagnostic groups (i.e., CU Aβ-, CU Aβ + , MCI Aβ + , Dementia Aβ+ participants, and pooled Aβ+ participants). Annual change rates of SV2A-PET w scores were measured in a subset of 18 Aβ+ participants. SV2A synaptic vesicle glycoprotein 2A, SUVR standardized uptake value ratio, CU cognitively unimpaired, MCI mild cognitive impairment, Aβ amyloid-beta.
Fig. 2
Fig. 2. Associations between brain connectivity and covariance in SV2A-PET w scores.
Covariance matrices of SV2A-PET w scores in CU Aβ- subjects (a, n = 54) and Aβ+ participants (b, n = 91). Group-average Fisher-z-transformed functional connectivity (FC) matrix (c) and log-transformed structural connectivity (SC) matrix (d) from 58 CU subjects with no evidence of abnormal amyloid-PET or tau-PET binding. (e-h) Density plots illustrated the distribution of the SV2A w-score covariance and brain connectivity. Scatterplots show the relationship between group-average functional connectivity and the covariance of the SV2A-PET w score in the CU Aβ- (i) and Aβ+ participants (j), as well as the relationship between structural connectivity and SV2A-PET w score covariance in Aβ + (k). β values were estimated by linear regressions. All two-sided p values estimated from linear regression models are <2.2 × 10⁻³⁰⁸. Linear model fits are indicated with 95% confidence intervals. To validate this association against the network topology, a one-sided permutation was performed by comparing the exact regression-derived β value against the null distribution from 1000 rewired network matrices (all prewired < 0.001). l The associations between functional connectivity and SV2A w-score covariance in CU Aβ- and Aβ+ participants were compared by two-sample t-test from 1000 bootstrapped samples (two-sided p < 2.2 × 10⁻³⁰⁸). m The associations derived from functional connectivity and structural connectivity in Aβ+ subjects were compared by paired t-test from 1000 bootstrapped samples (two-sided p = 4.25 × 10⁻2³). Boxes represent the interquartile range, with the median indicated by the center line. The bounds of the box correspond to the 25th and 75th percentiles. Whiskers extend to the minimum and maximum values within 1.5 interquartile range. FC functional connectivity, SC structural connectivity. Source data are provided in a Source data file.
Fig. 3
Fig. 3. Associations of regional synaptic loss with the brain network connectome.
a Schematic illustration of the model of network-associated synaptic loss. For a given index ROI (e.g., dark red), the SV2A-PET w score was modeled as the average of the w scores in the neighboring regions weighted by interregional connectivity. b The spatial association between the SV2A-PET w-score and averaged connectivity-weighted neighbor w-score was assessed against two null models accounting for autocorrelation (i.e., null spin) and network topology (i.e., null rewired). c As an example, the scatterplot shows the relationship between the group-average SV2A-PET w score in Aβ+ subjects (n = 91) and the functional connectivity-weighted neighbor w-score at the network sparsity of 25%, i.e., top 25% of connections with the strongest functional connectivity strength were preserved in the network. β and two-sided p value was derived from linear regression. The linear model fit is indicated with 95% confidence intervals. d The association was consistently significant compared to two null models (i.e., null spin and null rewired) when using functional connectivity matrix across different network sparsity (i.e., from 100% to 25%) and structural connectivity in Aβ+ subjects. *** indicates one-sided prewired or pspin < 0.001, without adjustment for multiple comparisons. e The model was assessed for each participant. The significance of the subject-level β-value distribution among Aβ+ individuals was assessed using two-sided one-sample t-tests, without adjustment for multiple comparisons. f The comparisons of subject-specific associations between CU Aβ- (n = 54) and Aβ+ subjects were conducted using linear regressions adjusting for age, sex, and education years (all two-sided p ≤ 0.001, uncorrected for multiple comparisons). Boxplots are displayed as median (center line) ± interquartile range (bounds) with whiskers including observations within the 1.5 interquartile range. ROI, region of interest. DMN, default mode network; FPCN, fronto-parietal control network; VAN, ventral attention network; DAN, dorsal attention network. Source data are provided in a Source data file.
Fig. 4
Fig. 4. Epicenter connectivity-based prediction of cross-sectional synaptic loss.
a A data-driven approach to identify the SV2A w score epicenter, adapted from the method proposed by Shafiei et al.. Epicenter likelihood was calculated as the mean rank of the regional SV2A-PET w score and connectivity-weighted neighbor w score. ROIs with significantly higher mean ranks compared to the distribution of null ranks from 1000 surrogate maps were identified as epicenters (one-sided pspin < 0.05, without multiple comparison correction). b Surface renderings show the group-average SV2A-PET w scores and epicenters functional connectivity (outlined in white) in Aβ+ group (n = 91). The association between SV2A-PET w score with epicenter connectivity was estimated by linear regression (p = 4.02×10⁻16, two-sided). To validate this association against the network topology, one-sided prewired value was identified by comparing exact β value with the null distributions from the 1000 rewired connectivity matrices. c Subject-level epicenter connectivity-based prediction of SV2A-PET w score in Aβ+ subjects. Surface rendering illustrates the overlap frequencies of subject-specific epicenter locations. Based on functional connectivity quantities to the subject-specific epicenter, the ROIs were divided into quartiles for each subject. Line charts show a gradual greater of synaptic loss across the ROIs weakly connected to the epicenters (i.e., Q1) to those strongly connected (i.e., Q4). β values and two-sided p values were estimated from linear mixed-effect regression models. d Subject-level epicenter connectivity-based prediction of SV2A-PET w score in CU Aβ- subjects (n = 54). e The epicenter probabilities were stratified according to the canonical functional networks in CU Aβ- (green line) and Aβ + (red line) groups. f A linear regression was applied for each subject to assess the association between subject-specific epicenter connectivity and SV2A-PET w-score. The subject-level regression-derived β values were compared between CU Aβ- and Aβ+ subjects using linear regression. Linear model fits are indicated with 95% confidence intervals. Boxplots are displayed as median (center line) ± interquartile range (bounds) with whiskers including observations within the 1.5 interquartile range. DMN default mode network, FPCN fronto-parietal control network, VAN ventral attention network, DAN dorsal attention network. Source data are provided in a Source data file.
Fig. 5
Fig. 5. Association between functional connectivity to baseline epicenter and longitudinal changes in SV2A-PET w score in a subset of 18 Aβ+ participants.
a The group-level linear regression model was applied to assess the association between functional connectivity to group-level baseline epicenter and group-average annual change rates of SV2A-PET w-score in Aβ+ participants (n = 18), controlling for the baseline SV2A-PET w score (β = 0.20, two-sided p = 0.009). To validate this association against the network topology, a one-sided permutation was performed by comparing the exact regression-derived β value against the null distribution from 1000 rewired network matrices (prewired < 0.001). Linear model fits are indicated together with 95% confidence intervals. The group-level association is assessed iteratively on 1000 bootstrapped samples. The distribution of resulting β-values is tested using a one-sample t-test (two-sided p < 2.2 × 10⁻³⁰⁸). b Subject-level analysis of individual synaptic density change rates was applied for each subject with subject-specific epicenters. The significance of the distribution of linear regression-derived β-values was tested using a one-sample t test (two-sided p = 0.004). Boxplots are displayed as median (center line) ± interquartile range (bounds) with whiskers including observations within the 1.5 interquartile range. Source data are provided in a Source data file.
Fig. 6
Fig. 6. The effect of p-tau and Aβ on connectivity-mediated synaptic loss.
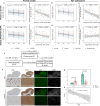
The line charts illustrated the interaction effect estimated from linear mixed effect regressions between plasma p-tau181 level and the functional connectivity (i.e., Q1-Q4) to epicenters (first row) on mean SV2A-PET w-scores, and global AV45-PET SUVR and functional connectivity to epicenters on mean SV2A-PET w-scores (second row) respectively in pooled sample (a, c, n = 88) and Aβ+ subjects (b, d, n = 56). The scatterplots show that associations estimated from linear regressions between connectivity-based SV2A-PET w-score (β values derived from subject-level linear regression) and the concentration levels of plasma p-tau181 (first row), as well as global AV45-PET SUVR (second row), respectively among pooled sample (a, c) and Aβ+ subjects (b, d). e The mediation effect of plasma p-tau181 concentration on the association between global AV45-PET SUVR and connectivity-based SV2A w-score among the pooled sample. f The presence of Aβ plaques (4G8 staining), relatively lower intensities of SV2A, and tau (AT8 staining, green) in postmortem brain tissue of entorhinal cortex from AD patients (n = 5) than in the controls (n = 4). Nuclei were counterstained with DAPI (white). Scale bars = 2000 μm (row 1, 3) and 50 μm (row 2, 4). g Significantly reduced levels of SV2A and increased levels of AT8 were found in the entorhinal cortex of AD patients compared to those in the controls indicated by Mann-Whitney test. Bar heights represent group means, and error bars represent ±1 standard error of the mean (SEM). h The association between the levels of AT8 and SV2A is tested using Spearman correlation. Linear model fits are indicated together with 95% confidence intervals. The statistical significance is assessed using two-sided tests. Source data are provided in a Source data file.

References

    1. Jack, C. R. Jr. et al. NIA-AA research framework: toward a biological definition of Alzheimer’s disease. Alzheimer’s Dement.14, 535–562 (2018). - PMC - PubMed
    1. Terry, R. D. et al. Physical basis of cognitive alterations in Alzheimer’s disease: synapse loss is the major correlate of cognitive impairment. Ann. Neurol.: Off. J. Am. Neurological Assoc. Child Neurol. Soc.30, 572–580 (1991). - PubMed
    1. Chen, M.-K. et al. Assessing synaptic density in Alzheimer disease with synaptic vesicle glycoprotein 2A positron emission tomographic imaging. JAMA Neurol.75, 1215–1224 (2018). - PMC - PubMed
    1. Naganawa, M. et al. First-in-human evaluation of (18)f-synvest-1, a radioligand for pet imaging of synaptic vesicle glycoprotein 2A. J. Nucl. Med62, 561–567 (2021). - PMC - PubMed
    1. Finnema, S. J. et al. Imaging synaptic density in the living human brain. Sci. Transl. Med8, 348ra396 (2016). - PubMed

MeSH terms