. 2025 Jul 10;16(1):6348.
doi: 10.1038/s41467-025-61741-x.

Structural insights into pre-pore intermediates of alpha-hemolysin in the lipidic environment

Affiliations

Structural insights into pre-pore intermediates of alpha-hemolysin in the lipidic environment

Arnab Chatterjee et al. Nat Commun. .

Abstract

The infectious microbe Staphylococcus aureus releases an array of cytotoxic pore-forming toxins (PFTs) that severely damage the cell membrane during bacterial infection. However, the interaction interfaces between the host cell membrane and toxin were hardly explored. So far, there are no pore, and intermediate structures of these toxins available in the presence of bio-membrane, which could elucidate the pore-forming mechanism. Here, we investigate the structure of different conformational states of this alpha-hemolysin (α-HL/Hla), a β-PFT in lipidic environment using single-particle cryo-EM. Additionally, we explore lipid destabilization by the toxin, using single-molecule imaging, confocal imaging, and validation of lipid-protein interactions using mutational studies. We elucidate eight cryo-EM structures of wildtype α-HL with various liposomes, which are composed of either 10:0 PC or Egg-PC/Cholesterol or Egg-PC/Sphingomyelin or 10:0 PC/Sphingomyelin. Our structural and biophysical studies confirm that different chain lengths and various membrane compositions facilitate the formation of intermediate pre-pores and complete pore species. We also demonstrate that the percentage of pre-pore population increases due to sphingomyelin-induced membrane rigidity. Altogether, this study unveils the structure-function analysis of the pre-pore to pore transition of wildtype α-HL during its crosstalk with the lipid membrane.


Conflict of interest statement

Competing interests: The authors declare no competing interests.

Figures
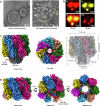
Fig. 1
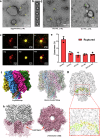
Fig. 1. 10:0 PC lipid layer promotes heptameric pore and pre-pore structures formation.
a NS-TEM analysis showed the complete rupture of 10:0 PC liposomes after toxin (50 nM) treatment (right-hand panel, toxin is marked using yellow arrowhead) as compared to control liposomes (left-hand panel). This experiment was done in triplicate independently. b TIRFM imaging confirmed the lysis and size reduction of fluorescent NBD-labeled liposome (red-colored) and the subsequent leakage of encapsulated rhodamine dye (yellow-colored) while passing of α-HL in the microfluidic channel. Frame 1(F1) indicates the liposomes at the point of toxin flow start, and Frame 60 is at the end of toxin flow. c The lateral and top views of the heptameric pore 2.8 Å cryo-EM map are shown in different colors corresponding to each protomers. The 3.55 nm long lipid densities (gray) surround the transmembrane (TM) channel. The pore structure is shown fitted with atomic model (cartoon). d Cryo-EM map of the 2.9 Å heptameric pre-pore structure is showing in three different angles (0°, 45°, and 90°) sighting a small extension of the non-TMs barrel (highlighted using red arrow).
Fig. 2
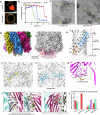
Fig. 2. Heptameric pore structure of α-HL in the presence of Egg-PC/Cholesterol liposome.
a NS-TEM analysis of α-HL added to Egg-PC/Cholesterol liposomes showed the formation of distinct pore shapes on the lipid membrane (yellow arrowhead). The experiment was done in triplicate independently. b NS-TEM 2D class averages of oligomers (scale bar, 10 nm). c Single-molecule imaging showed leakage of encapsulated dye (rhodamine dye, λemission = 570 nm, yellow-colored) from liposomes after α-HL (10 nM) treatment on NBD tagged (λemission = 540 nm) Egg PC/Chol liposomes (red-colored). Frame1 is just after toxin addition, and frame60 is after 50 sec of toxin treatment. d NS-TEM imaging showed lipid-oligomeric species cluster (yellow arrowhead) originated from 14:0 PC liposomes. Formation of oligomeric pore structure covered on the 18:1 PC liposomes (yellow arrow). Data are presented as mean ± SD of triplicate measurements (n = 3 independent experiments). e Bar plot depicting the extent of different liposome ruptures after toxin treatment. The Y axis represented the percentage of ruptured liposomes, and the X axis showed different PC types. f Cryo-EM map, fitted model in the density map of α-HL pore conformation derived from Egg-PC/Chol liposomes. g Lipid fitting of 16:0-18:1 PC chain (in red and green color) at the extra density near rim and upper TMs. The interacting amino acids, with the lipid chain (in red) are W179, Y191, and N201 (in blue). h The red color density at the bottom of the pore state showed the distribution of the lipid density at 0.058 threshold.
Fig. 3
Fig. 3. Lipid-protein interfaces of 10:0 PC derived α-HL heptameric pore and pre-pore structures.
a, b The selected enlarged section of the representation of the pore conformation showed the location and fitting of the 10:0 PC lipid chain (red color) into cryo-EM density (in yellow color) located at the rim and upper TMs part. c The top part of the stem and bottom part of the rim domains depicted lipid-binding residues Y112, H144 (in deep pink color), Y118 (in green color), W179, Y191, and R200 (in golden color). d The compromised hemolytic assay showed the effect after mutations of lipid binding residues, single mutants Y112 (in blue color), Y191 (in purple color), and double mutant W179-R200 (in cyan color). The Y axis showed Absorbance at 620 nm, and the X axis showed time in minutes. Data are presented as mean ± SD of triplicate measurements (n = 3 independent experiments).
Fig. 4
Fig. 4. Sphingomyelin incorporated lipid bilayer restricted membrane perforation and generated late pre-pore state of α-HL.
a Confocal images of 10:0 PC and 10:0 PC/SM in the presence of lipophilic membrane staining dye Nile red. SM incorporated 10:0 PC liposomes showed a relatively higher emission intensity of Nile red at 525−565 nm (yellow color). b Comparison of single-molecule based different liposomes encapsulated rhodamine leakage assay. The Y axis showed fluorescence intensity at 516 nm, and the X axis showed time in seconds. Data are presented as mean ± SD of triplicate measurements (n = 3 independent experiments). c NS-TEM micrograph showed a distribution of oligomeric toxin (yellow arrow) on the 10:0 PC/SM. and Egg-PC/SM liposomes. This experiment was done in triplicate independently. d The cryo-EM 3D reconstruction of the late pre-pore state (lateral view) on the left side at a resolution of 2.6 Å. Thick lipid density (red, at a threshold of 0.05) coated the upper TMs channel. e Cartoon model of transmembrane domain showing the missing density in bottom TMs and cytosolic loop of late pre-pore state. f Lipid fitting of 10:0 PC chain at the extra density between lower part of rim (in blue color) and upper TMs (in yellow color). g Enlarged view of the lipid distribution of 10:0 PC at the vicinity of the bottommost part of rim (in blue color). h The residues of rim domain involved in the interaction with lipids (in yellow color) are W179, N188, and Y191 (in orchid color). i Late pre-pore structure with conserved interfacial interactions like pore structure (dominated by polar residues; ball and stick) at upper (i) and lower cap domains (ii) in between protomers, N-terminal segment (iii) of adjacent protomer maintaining several dipolar interactions with two vicinal protomers. The cartoon representations of adjacent protomers were shown in different colors (cyan, violet, and green, respectively). j Distribution of different oligomeric species derived from different lipid membranes.
Fig. 5
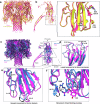
Fig. 5. Conformational re-arrangements of α-HL protomers during pore formation and re-modulated lipid-protein interfaces in pre-pore structures.
a The structural superposition of heptameric pore conformation from 10:0 PC (deep pink) and half-barrel late pre-pore state (golden) from 10:0 PC/SM. b The residues having minor conformational changes are R66, E70, and N209 shown in ball and stick. c The structural superposition of protomers from pore structure (deep pink) and pre-pore structures (blue) derived from 10:0 PC. The cartoon representation suggested missing stem domain of the pre-pore (orange arrow). Conformational changes in upper cap and lower rim domains were highlighted (black dotted box). d Enlarged view represented a concerted inside and downward shift (w.r.t. pore axis) of (β2-β3) and (β10-β11) in the pre-pore structure. e The cartoon representation of superimposed rim domains showing upwards movements (shown in arrowhead) of pre-pore structure. f The movement of the lipid binding residues at the lower rim domain is highlighted in the ball and stick model.
Fig. 6
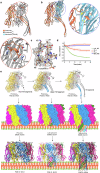
Fig. 6. An overview of structural re-arrangements of α-HL monomer to heptameric pore maturation and impact of N-terminal on pre-stem unfolding.
a The cartoon representation of two α-HL pore protomers, showed N-terminal segments of promoter (orange) interacting with the cap domain of adjacent protomer (gray). Detailed interactions were highlighted in an enlarged view. b The possible steric hindrance of N-terminal segment A1-T9 of one protomer with the pre-stem domain of adjacent structurally superimposed monomer (zoomed view). c The side chain density in inside map density (shown in mess) fitting of A1-T9. d A compromised hemolytic activity for partial (A1-D4) N-terminal truncated α-HL (in red color) and completely abolished hemolytic (A1-T9) N-terminal truncated α-HL (in orange color). The Y axis showed Absorbance at 620 nm, and the X axis showed time in minutes. Data are presented as mean ± SD of triplicate measurements (n = 3 independent experiments). e The cartoon representation of structurally aligned protomers of three different states of α-HL protomers (protomerlpp, protomerpp. and protomermp) showed a significant conformational change dominated in the stem domain along with geometrical deviation in the cap and rim region. Each promoter of these three heptameric conformations showed in different colors on a hypothetical membrane bilayer (lipid head group in green color, and tail in orange color).

References

    1. Harayama, T. & Riezman, H. Understanding the diversity of membrane lipid composition. Nat. Rev. Mol. Cell Biol.19, 281–296 (2018). - PubMed
    1. van Meer, G., Voelker, D. R. & Feigenson, G. W. Membrane lipids: where they are and how they behave. Nat. Rev. Mol. Cell Biol.9, 112–124 (2008). - PMC - PubMed
    1. Frallicciardi, J., Melcr, J., Siginou, P., Marrink, S. J. & Poolman, B. Membrane thickness, lipid phase and sterol type are determining factors in the permeability of membranes to small solutes. Nat. Commun.13, 1605 (2022). - PMC - PubMed
    1. Dal Peraro, M. & van der Goot, F. G. Pore-forming toxins: ancient, but never really out of fashion. Nat. Rev. Microbiol14, 77–92 (2016). - PubMed
    1. Bischofberger, M., Iacovache, I. & van der Goot, F. G. Pathogenic pore-forming proteins: function and host response. Cell Host Microbe12, 266–275 (2012). - PubMed

MeSH terms

LinkOut - more resources