. 2025 Jul 10;16(1):6397.
doi: 10.1038/s41467-025-61759-1.

PIP4K2C inhibition reverses autophagic flux impairment induced by SARS-CoV-2

Affiliations

PIP4K2C inhibition reverses autophagic flux impairment induced by SARS-CoV-2

Marwah Karim et al. Nat Commun. .

Abstract

In search for broad-spectrum antivirals, we discover a small molecule inhibitor, RMC-113, that potently suppresses the replication of multiple RNA viruses including SARS-CoV-2 in human lung organoids. We demonstrate selective inhibition of the lipid kinases PIP4K2C and PIKfyve by RMC-113 and target engagement by its clickable analog. Lipidomics analysis reveals alteration of SARS-CoV-2-induced phosphoinositide signature by RMC-113 and links its antiviral effect with functional PIP4K2C and PIKfyve inhibition. We identify PIP4K2C's roles in SARS-CoV-2 entry, RNA replication, and assembly/egress, validating it as a druggable antiviral target. Integrating proteomics, single-cell transcriptomics, and functional assays, reveals that PIP4K2C binds SARS-CoV-2 nonstructural protein 6 and regulates virus-induced autophagic flux impairment. Promoting viral protein degradation by reversing autophagic flux impairment is a mechanism of antiviral action of RMC-113. These findings reveal virus-induced autophagy regulation via PIP4K2C, an understudied kinase, and propose dual PIP4K2C and PIKfyve inhibition as a candidate strategy to combat emerging viruses.


Conflict of interest statement

Competing interests: The authors declare no competing interests.

Figures

Fig. 1
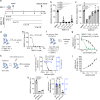
Fig. 1. RMC-113 inhibits SARS-CoV-2 infection in vitro and in human ALOs with a high genetic barrier to resistance.
a Chemical structure of RMC-113. b Rescue assay for virus-induced cell lethality. RMC-113 (10 μM) was incubated with Vero E6-eGFP cells for 20 h followed by SARS-CoV-2 infection. eGFP signal measured at 96 hpi indicates cell survival. c and d Fluorescence images (c) and corresponding graph (d) of Vero-eGFP cells rescued from SARS-CoV-2-induced lethality by RMC-113 (Belgium-GHB-03021 strain, MOI = 0.05). Original magnification, ×5 (c). e and j, Dose response to RMC-113 of SARS-CoV-2 infection [black, USA-WA1/2020 strain, MOI = 0.05 (e), 1 (j)] and cell viability (blue) in Calu-3 cells (e) or ALO-derived monolayer supernatants (j) via plaque and alamarBlue assays at 24 (e) or 48 (j) hpi, respectively. f and i, Schematics of the experiments shown in g (f) and j, k, l (i), respectively. Figure was created in BioRender. Karim, M. (2025) https://biorender.com/2yx5sx9. g, Vero E6-TMPRSS2 cells were infected with rSARS-CoV-2-nLuc virus (MOI = 0.05) and passaged daily under RMC-113 (0.1–0.3 μM) or DMSO over nine passages. Viral titers were measured by plaque assays. h, Dose response to RMC-113 of rSARS-CoV-2-nLuc virus harvested after nine passages under RMC-113 or DMSO via luciferase assays. k Dose response to RMC-113 of SARS-CoV-2 (MOI = 1) nucleocapsid copy number in ALO lysates measured by RT-qPCR assays at 48 hpi. l Confocal IF microscopy images of F-actin (violet), nucleocapsid (green), and DAPI (blue) in uninfected and SARS-CoV-2–infected ALOs, pretreated with DMSO or RMC-113 (5 μM) at 24 hpi. Representative merged images at x40 magnification are shown. Scale bars: 50 μm. Data shown are representative of independent experiments (c, d, j, l) or represent combined results from two (n = 2; e, g, h) or three (n = 3; k) independent experiments. Data in e, h, j, and k are relative to DMSO. Means ± SD are shown. Source data are provided as a Source Data file.
Fig. 2
Fig. 2. RMC-113 is a selective kinase inhibitor that stably binds PIKfyve and PIP4K2C.
a Kinase abundance ratio between RMC-113 (0.1, 1.0, and 10 µM)- and DMSO-treated SUM159 cell lysates measured by multiplexed inhibitor beads kinome profiling and mass spectrometry (MIB/MS). Shown are the Log2 fold change mean values ± SD of 2 replicates of a subset of the screen panel (see Supplementary Fig. 2a). b and c In vitro dose response of PIKfyve activity (b) and PIP4K2C binding (c) to RMC-113. d Biochemical parameters for RMC-113 and SRN2-002. ND = Not determined. e Chemical structure of SRN2-002. f Dose response of SARS-CoV-2 infection (MOI = 0.05, black) and cell viability (blue) to SRN2-002 in Calu-3 cells via plaque and alamarBlue assays at 24 hpi, respectively (n = 2 independent experiments). g Kinase expression in SARS-CoV-2-infected A549-ACE2 lysates following incubation with SRN2-002 individually or combined with RMC-113, UV irradiation, and streptavidin pull-down measured by Western blotting at 24 hpi. Representative membranes of n = 2 experiments are shown. Lanes: 1: SRN2-002, no UV; 2: SRN2-002, no pull-down; 3: SRN2-002 (1 µM); 4: SRN2-002 (5 µM); 5: SRN2-002 (1 µM) competitively inhibited by RMC-113 (10 µM); 6: SRN2-002 (5 µM) competitively inhibited by RMC-113 (50 µM). h, Putative binding mode of RMC-113 into the kinase ATP-binding pockets based on microsecond timescale MD simulations. A representative snapshot with key interactions is shown (see i–l for details). Binding pocket residues with >10% interaction frequencies to RMC-113 are shown. Positively charged residues are highlighted in blue; negative charge, red; hydrophobic, green; polar, cyan. RMC-113 is shown in yellow (carbon) stick model. H-bonds are illustrated with purple dashed lines, π–π interactions with green. i and k, Summary of main protein-ligand interactions ( > 10% frequency) in the MD simulations of PIKfyve (i) and PIP4K2C (k). j and l Aggregate of protein-ligand interactions (residues with >10%) in the simulations of PIKfyve (j) and PIP4K2C (l). Means ± SD are shown (f). Data in (i and j) consist of 72 μs, and (k and l) consist of 20 μs, both analyzed each 1 ns. Source data are provided as a Source Data file.
Fig. 3
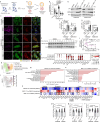
Fig. 3. PIKfyve and PIP4K2C are essential for SARS-CoV-2 infection and mediate the antiviral effect of RMC-113.
a, g, k, Schematics of the experiments in b, c, d (a); h, i (g); and l, m, n (k). b and c Confirmation of siRNA-mediated knockdown of PIKfyve and PIP4K2C by RT-qPCR (b) and Western blot (c) in Calu-3 cells. Shown are gene expression levels normalized to GAPDH relative to respective gene levels in siNT control (b) and representative membranes and quantitative data (c) at 48 h post-transfection. d Viral titers (PFU/ml) and cell viability (blue) in Calu-3 cells transfected with the indicated siRNAs at 24 hpi with SARS-CoV-2 (MOI = 0.05) via plaque and alamarBlue assays, respectively. e Chemical structures of PIKfyve and/or PIP4K2C inhibitors. f Dose response of rSARS-CoV-2-nLuc (black, USA-WA1/2020 strain, MOI = 0.05) infection and cell viability (blue) in Calu-3 cells via luciferase and alamarBlue assays at 24 hpi, respectively. h and i Rescue of rVSV-SARSCoV-2-S infection under RMC-113 treatment upon ectopic expression of WT PIKfyve (h) and PIP4K2C (i) their kinase-dead mutants or empty control plasmids measured by luciferase assays at 24 hpi in Vero cells. j Schematic representation of phosphoinositides and associated kinases. Figure was created in BioRender. Karim, M. (2025) https://biorender.com/yynkvs0. l and m, Fold change (FC) of peak area ratio of the indicated phosphoinositides in SARS-CoV-2-infected (MOI = 0.5) vs. uninfected (l) and RMC-113- vs. DMSO-treated infected A549-ACE2 cells (m) as measured via PRMC-MS. n, Product-to-substrate ratios in RMC-113- vs. DMSO-treated cells infected with SARS-CoV-2 (l, m). Data shown are representative of independent experiments (c) or represent combined results from two (n = 2; f, h, i) or three (n = 3; b, d) independent experiments. Data is relative to siNT (b, d) or DMSO (f, h, i). Means ± SD are shown (b, d, f, h, i). l, m, n represent one of two independent experiments. See an associated experiment in Supplementary Fig. 6e–g and Supplementary Data 2. P values by 1-way ANOVA followed by Dunnett’s (b, d) multiple-comparison test are indicated. Source data are provided as a Source Data file.
Fig. 4
Fig. 4. PIP4K2C is required for temporally distinct stages of the SARS-CoV-2 life cycle, whereas PIKfyve is required for viral entry only.
a Schematic of the time-of-addition experiments shown in b, c. b and c Calu-3 cells were infected with WT SARS-CoV-2 (MOI = 1). At the indicated times, RMC-113 (10 μM) (b), apilimod (10 μM) (c), or DMSO were added. Supernatants were collected at 10 hpi, and viral titers measured by plaque assays. d, f and h, Schematics of the experiments shown in e, k (d); g, j, l (f) and i (h). e, Dose response to RMC-113 of WT SARS-CoV-2 entry (MOI = 1) in Calu-3 cell lysates measured by RT-qPCR assays at 2 hpi. g, Dose response to RMC-113 and ensitrelvir of viral RNA replication measured by luciferase assay in Vero E6 cells 24 h post-transfection of in vitro transcribed nano-luciferase reporter-based SARS-CoV-2 subgenomic non-infectious replicon. i Dose response to apilimod of rVSV-SARS-CoV-2-S infection (black) and cell viability (blue) in Vero cells via luciferase and alamarBlue assays at 24 hpi, respectively. j Dose response to apilimod of viral RNA replication measured by luciferase assay in Vero E6-TMPRSS2 cells 24 h post-transfection of in vitro transcribed nano-luciferase reporter-based SARS-CoV-2 subgenomic non-infectious replicon. k WT SARS-CoV-2 (MOI = 1) entry measured in Calu-3 cells depleted of the indicated kinases using corresponding siRNAs by RT-qPCR at 2 hpi. l, Viral RNA replication and cell viability (blue) measured by luciferase and alamarBlue assays, respectively, in Vero E6 cells depleted of the indicated kinases, 24 h post-transfection of in vitro transcribed nano-luciferase reporter-based SARS-CoV-2 subgenomic non-infectious replicon. Data shown are representative of independent experiments (i) or represent combined results from two (n = 2; e, g, j) or three (n = 3; b, c, k, l) independent experiments. Means ± SD are shown. Data is relative to DMSO (b, c, e, g, i, j) or siNT (k, l). P values by 1-way ANOVA followed by Tukey’s (b, c) or Dunnett’s (k, l) multiple-comparison test are indicated. ns= non-significant. Source data are provided as a Source Data file.
Fig. 5
Fig. 5. RMC-113 reverses SARS-CoV-2-induced impairment of autophagic flux and accelerates viral protein degradation.
a Schematic for c and d. b Autophagy flux: from autophagosomes (yellow, RFP + /GFP + ) to autolysosomes (red, RFP+/GFP-). Figure was created in BioRender. Karim, M. (2025) https://biorender.com/yynkvs0. c, Representative confocal images (x40) of A549-ACE2 cells expressing GFP-RFP-LC3, infected with SARS-CoV-2 (MOI = 0.5), treated with DMSO, RMC-113 (5 μM), apilimod (5 μM) or CQ (10 μM) for 24 h, and stained for nucleocapsid (violet). Scale bars: 10 μm. Zoomed-in images: autophagosomes (yellow); autolysosomes (red). d, Autolysosome-to-autophagosome ratio in 70 single cells (c). e–g Autophagy marker expression in uninfected and SARS-CoV-2-infected (MOI = 1) A549-ACE2 lysates treated with RMC-113 (5 µM) and/or CQ (10 µM) or DMSO at 24 hpi via immunoblotting (e). Quantification of p62/actin (f) and LC3II/actin (g) ratios normalized to DMSO (n = 4 membranes). h and i, Representative membranes (h) and quantification (i) (n = 3 membranes) showing ORF3A half-life in A549-ACE2 lysates after RMC-113 (5 µM) or DMSO treatment. j, Marker genes annotating cell populations. Color: expression (cpm); dot size: expressing cell fraction. k and l UMAP embedding of scRNA-seq dataset indicating distinct cell types (k) or SARS-CoV-2 transcripts (l). m and n Pathway enrichment in AT2 cells infected vs. uninfected (m) and RMC-113 vs. DMSO treated (n) ALOs. o, Heatmap of log2 fold-change in autophagy-related genes between infected vs. uninfected (DMSO), RMC-113 vs. DMSO (uninfected), and RMC-113 vs. DMSO (infected) AT2-like cells at 24 hpi. Black rectangles: significant changes (Wilcoxon test). See Supplementary Fig. 8b. p–r Box plots of gene expression in individual AT2 cells at 24 hpi. Horizontal lines indicate quartiles; whiskers extend to ±1.5 × interquartile range. Adjusted P values (two-sided Wilcoxon test, Benjamini-Hochberg correction). Data are representative of independent experiments (c, e, h) or combined results from three (n = 3; d, i–r) or four (n = 4; f, g) independent experiments. Means ± SD are shown (d, f, g, i). P values by 1-way (d) or 2-way (i) ANOVA with Tukey’s (d) or two-tailed unpaired t-test (f, g) or Šídák’s (i) multiple comparison test are indicated. ns= non-significant. Source data are provided as Source Data file.
Fig. 6
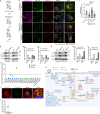
Fig. 6. PIP4K2C binds SARS-CoV-2 NSP6 and mediates virus-induced impairment of autophagic flux.
a Schematic of the experiment shown in b and c. b Representative confocal microscopic images of A549-ACE2 cells transfected with indicated siRNAs and GFP-RFP-LC3 tandem plasmid, and infected with SARS-CoV-2 (MOI = 0.5) for 24 h and stained for nucleocapsid (violet). Representative merged images at x40 magnification are shown. Scale bars: 10 μm. Zoomed-in images show autophagosomes (yellow) and autolysosomes (red). c Autolysosome-to-autophagosomes ratio (autophagy flux) in single cells (n = 27 cells per category) (b). d–i The expression levels of p62, LC3-I and LC3-II following transfection of siPIP4K2C (d–f) and siPIKfyve (g–i) in uninfected and SARS-CoV-2-infected A549-ACE2 cell lysates at 24 hpi. Bar graphs show quantitative analysis of p62/actin (e, h) and LC3II/actin ratios (f, i), from 2 membranes and normalized to corresponding siNT controls. j PIP4K2C and PIKfyve interactions with 15 SARS-CoV-2 nonstructural proteins, ORF3a, ORF7a, and empty plasmid as measured via protein-fragment complementation assay (PCAs) in HEK293T cells. Dots depict mean NLR values. The dotted line depicts the cutoff (NLR > 10) used to define PIP4K2C-interacting proteins (green), representing greater than two SDs above the mean NLR of a non-interacting reference set. k and l Confocal IF microscopy images of PIP4K2C (red) and NSP6 (green) in A549-ACE2 cells ectopically expressing FLAG-NSP6 24 h after transfection. Shown are images at 60× magnification with a 6-fold zoom in (right panel) (k) and Manders’ colocalization coefficients (M2: NSP6 overlapping PIP4K2C) (l) in 32 cells. Scale bar: 10 μm. m Proposed model for the roles of PIP4K2C and PIKfyve in SARS-CoV-2 infection and the mechanism of antiviral action of RMC-113. Figure was created in BioRender. Karim, M. (2025) https://biorender.com/glw3z17. Data are representative of independent experiments (b, d, g, k) or combined from two (n = 2; e, f, h, i, j) or three (n = 3; c, l) independent experiments. Data are relative to siNT (c, e, f, h, i). Means ± SD are shown (c, l). P values by 1-way ANOVA followed by Dunnett’s multiple comparison test are shown (c). Source data are provided as a Source Data file.

Update of

References

    1. Weaver, S. C., Ferro, C., Barrera, R., Boshell, J. & Navarro, J.-C. Venezuelan equine encephalitis. Annu. Rev. Entomol.49, 141–174 (2004). - PubMed
    1. Karim, M., Lo, C.-W. & Einav, S. Preparing for the next viral threat with broad-spectrum antivirals. J. Clin. Investig.133, e170236 (2023). - PMC - PubMed
    1. Llorente, A., Arora, G. K., Grenier, S. F. & Emerling, B. M. PIP kinases: a versatile family that demands further therapeutic attention. Adv. Biol. Regul.87, 100939 (2023). - PMC - PubMed
    1. Sbrissa, D., Ikonomov, O. C. & Shisheva, A. PIKfyve, a mammalian ortholog of yeast Fab1p lipid kinase, synthesizes 5-phosphoinositides: effect of insulin. J. Biol. Chem.274, 21589–21597 (1999). - PubMed
    1. Sharma, G. et al. A family of PIKFYVE inhibitors with therapeutic potential against autophagy-dependent cancer cells disrupt multiple events in lysosome homeostasis. Autophagy15, 1694–1718 (2019). - PMC - PubMed

MeSH terms

Substances

LinkOut - more resources