. 2025 Jul 10;16(1):6375.
doi: 10.1038/s41467-025-61749-3.

HP1 loses its chromatin clustering and phase separation function across evolution

Affiliations

HP1 loses its chromatin clustering and phase separation function across evolution

Sanâa Bensaha et al. Nat Commun. .

Abstract

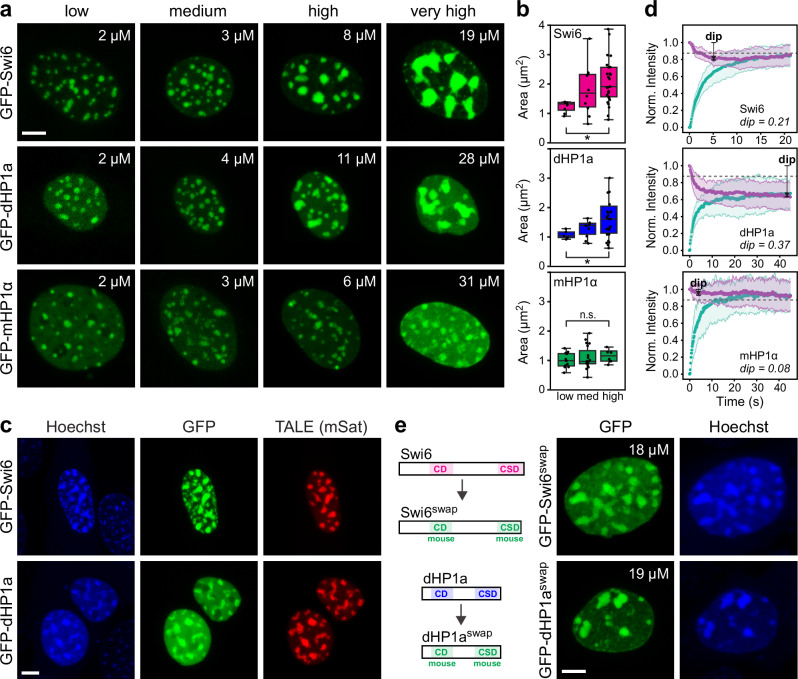
Heterochromatin protein 1 (HP1) is a multifunctional chromatin-associated protein conserved from fission yeast to mammals. HP1 has been suggested to drive heterochromatin formation via phase separation. However, there is seemingly conflicting evidence about HP1 phase-separating in different systems or not. Here, we assess the phase separation behavior of HP1 from fission yeast, fruit fly and mouse in vitro and in mammalian cells side-by-side. We find that HP1 from fission yeast and fly can undergo liquid-liquid phase separation and induce heterochromatin coalescence in mouse cells, in stark contrast to HP1 from mouse. Induced heterochromatin coalescence has only mild effects on gene expression. We link the decreasing phase separation propensity of HP1 homologs to their decreasing intrinsic disorder and their increasing sensitivity to HP1 paralogs antagonizing phase separation. Our work elucidates the relationship between phase separation, nuclear organization and gene expression, and highlights the evolutionary dimension of protein phase separation control.


Conflict of interest statement

Competing interests: The authors declare no competing interests.

Figures

Fig. 1
Fig. 1. Evolutionary decrease of HP1 disorder.
a Predicted disorder of the HP1 homolog with highest disorder in the indicated species using PONDR. b Domain organization and predicted disorder of fission yeast Swi6, fly HP1a and mouse HP1α. The chromodomains (left) and chromoshadow domains (right) are highlighted. c Kratky plots and pair distance distribution functions P(r) for fission yeast Swi6 (magenta), fly HP1a (blue) and mouse HP1α (green) obtained by SAXS. d Schematic models of the indicated HP1 dimers. e Same as panel c but for GFP-tagged HP1 homologs.
Fig. 2
Fig. 2. Evolutionary decrease in the LLPS propensity of recombinant HP1.
a, b Phase diagrams of GFP-tagged fission yeast Swi6, fly HP1a and mouse HP1α at different NaCl concentrations (a) and upon addition of DNA (b). All images are shown at the same magnification and were acquired with the same microscopy settings. Colored frames indicate condensate formation. Scale bars, 10 µm. c MOCHA-FRAP of condensates reconstituted with 50 µM of the indicated protein and DNA at 70 mM NaCl. The green and the violet line shows the intensity in the bleached and non-bleached half, respectively. The indicated dip depths, which correspond to the minimum intensities in the non-bleached halves, translate into apparent interfacial barriers of 0.02 kT (Swi6, mHP1α) and 0.03 kT (dHP1). The dashed gray line shows the dip depth that is expected in the absence of any interfacial barrier. Data are presented as means ± standard deviations. Source data are provided as a Source Data file.
Fig. 3
Fig. 3. Evolutionary appearance of HP1 paralogs antagonizing phase separation.
a Average abundance of different HP1 paralogs in different species. Data were taken from PaxDB. See Supplementary Fig. 4 for data from individual tissues. Data are presented as weighted means ± weighted standard deviations. b Recombinant RFP-mHP1β impaired condensate formation of GFP-mHP1α but not of GFP-dHP1a and GFP-Swi6. All protein concentrations were 125 µM, NaCl concentrations were 75 mM. Scale bar, 5 µm. c The RFP-mHP1βI161E mutant did not impair GFP-mHP1α condensate formation. Conditions were the same as in panel b, images are shown at the same magnification. d Fluorescence anisotropy assays indicating that recombinant RFP-mHP1β can disrupt GFP-mHP1α homodimers but not GFP-dHP1a or GFP-Swi6 homodimers. lw, low concentration (200 nM); hi, high concentration (2 µM). For RFP-mHP1β titrations, GFP-mHP1α, GFP-dHP1a and GFP-Swi6 concentrations were kept at 2 µM, NaCl concentrations were kept at 150 mM. No condensates were observed under these conditions. Data are presented as means ± standard deviations. e Fluorescence anisotropy assays indicating that recombinant RFP-mHP1βI161E cannot disrupt GFP-mHP1α homodimers. Conditions were the same as in panel d. Data are presented as means ± standard deviations. f Dissolution kinetics of GFP-mHP1α condensates upon addition of RFP-mHP1β. Conditions were the same as in panel b. Scale bar, 2 µm. g Fluorescence anisotropy images during dissolution of GFP-mHP1α condensates by RFP-mHP1β. Conditions were the same as in panel b. Scale bar, 2 µm. Source data are provided as a Source Data file.
Fig. 4
Fig. 4. Evolutionary decrease in the capacity of HP1 to drive heterochromatin coalescence.
a Expression of GFP-tagged Swi6 and dHP1a induced heterochromatin coalescence in mouse NIH3T3 cells, as opposed to expression of mHP1α. Expression levels determined via calibration with a GFP standard (Supplementary Fig. 9a) are indicated in the top right corners. Low, 0.0–2.5 μM; med, 2.5–5.0 μM; high, > 5.0 μM. All cells are shown at the same magnification. Scale bar, 5 μm. b Area of heterochromatin foci versus GFP-HP1 expression levels. Groups are defined as in panel a. *, p < 0.05; n.s., not significant (two-sided Welch’s t-test). See Statistics and reproducibility for further details. c Localization of TALEs that recognize major satellite sequences in cells expressing GFP-Swi6 (top) or GFP-dHP1a (bottom). Non-transfected cells were included as a reference (bottom right in each image). Scale bar, 5 μm. d MOCHA-FRAP of the different GFP-tagged HP1 homologs in cells with expression levels of ~4 μM. The green and the violet line shows the intensity in the bleached and non-bleached half, respectively. The dip depths, which correspond to the minimum intensities in the non-bleached halves, indicate that there is an interfacial barrier for dHP1a and Swi6 but not for mHP1α (the violet curve crosses the dashed gray line for dHP1a and Swi6 but not for mHP1α). Data are presented as means ± standard deviations. e Expression of chimeric versions of GFP-Swi6 and GFP-dHP1a, which contained the chromo- and chromoshadow domain of mHP1α, also induced heterochromatin coalescence. Scale bar, 5 μm. Source data are provided as a Source Data file.
Fig. 5
Fig. 5. HP1β antagonizes phase separation in mouse cells.
a GFP-mHP1α formed droplet-like structures (arrows) when expressed for 24 h in BMEL TKO cells lacking all three endogenous HP1 paralogs (top). After prolonged expression in TKO cells, GFP-mHP1α bound chromocenters (center). GFP-mHP1α also bound chromocenters in BMEL cells lacking only endogenous HP1α (bottom). b GFP-Swi6 and GFP-dHP1a also formed droplet-like structures in BMEL TKO cells. After prolonged expression at high levels, both proteins bound chromocenters and induced heterochromatin coalescence. Cells in both panels are shown at the same magnification. Red signals in both panels represent the nucleolar marker RFP-nucleolin. Scale bars, 5 μm.
Fig. 6
Fig. 6. Decoupling between HP1-driven heterochromatin reorganization and gene regulation.
a Expression of GFP-tagged dHP1a and subsequent heterochromatin coalescence had only mild effects on gene expression, while expression of GFP-tagged Swi6 significantly altered the expression of 132 genes (117 genes upregulated, red; 15 genes downregulated, blue; padj < 0.05). p-values were obtained with a Wald test, padj-values were corrected for multiple testing. b Genomic positions of differentially expressed genes (DEGs) upon induction of GFP-Swi6. DEGs are not enriched near pericentromeres, which are located close to the left end of telocentric mouse chromosomes. c Manhattan plot showing gene ontology enrichments of DEGs. BP, biological processes; CC, cellular components. padj-values were obtained with a hypergeometric test and were corrected for multiple testing. d Estimated levels of major satellite repeat transcripts did not significantly change upon expression of GFP-tagged HP1 homologs. e Two mechanisms modulate (liquid) phase separation of HP1 across evolution: (i) The intrinsic disorder of HP1 decreases from fission yeast to mammals, and (ii) the abundance of HP1 paralogs that antagonize LLPS increases. These changes go along with alterations of HP1 function. Source data are provided as a Source Data file.

References

    1. James, T. C. & Elgin, S. C. Identification of a nonhistone chromosomal protein associated with heterochromatin in Drosophila melanogaster and its gene. Mol. Cell. Biol.6, 3862–3872 (1986). - PMC - PubMed
    1. Lorentz, A., Ostermann, K., Fleck, O. & Schmidt, H. Switching gene swi6, involved in repression of silent mating-type loci in fission yeast, encodes a homologue of chromatin-associated proteins from Drosophila and mammals. Gene143, 139–143 (1994). - PubMed
    1. Singh, P. B. et al. A sequence motif found in aDrosophila heterochromatin protein is conserved in animals and plants. Nucleic Acids Res19, 789–794 (1991). - PMC - PubMed
    1. Jacobs, S. A. & Khorasanizadeh, S. Structure of HP1 chromodomain bound to a lysine 9-methylated histone H3 tail. Science295, 2080–2083 (2002). - PubMed
    1. Nielsen, P. R. et al. Structure of the HP1 chromodomain bound to histone H3 methylated at lysine 9. Nature416, 103–107 (2002). - PubMed

MeSH terms

LinkOut - more resources