

Global health burden and inequality patterns of occupational noise exposure from 1990 to 2019
- PMID: 40640340
- PMCID: PMC12246141
- DOI: 10.1038/s41598-025-09575-x
Global health burden and inequality patterns of occupational noise exposure from 1990 to 2019
Abstract
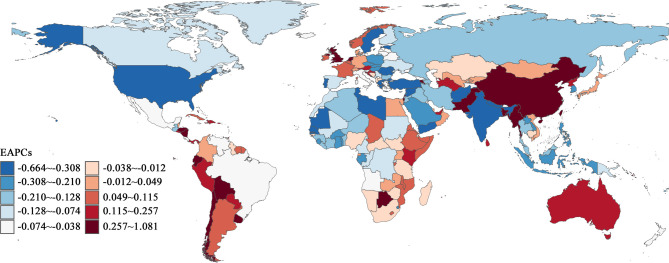
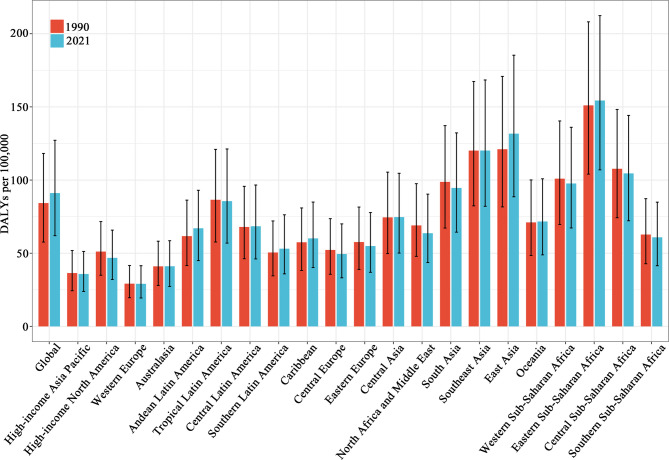
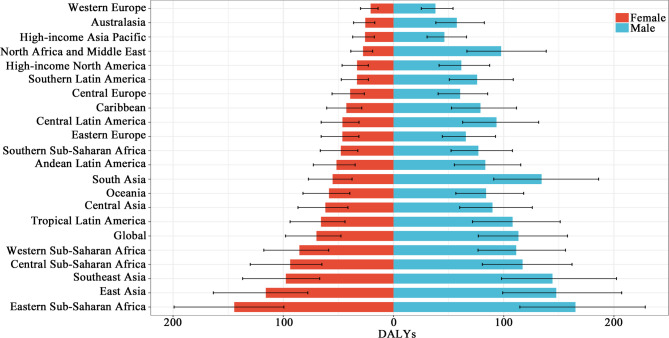
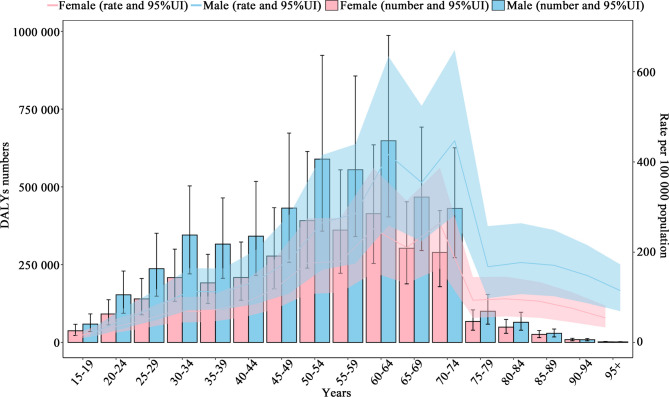
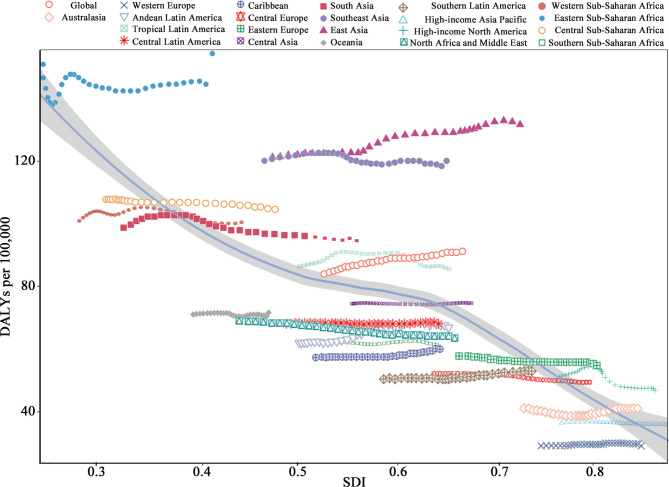
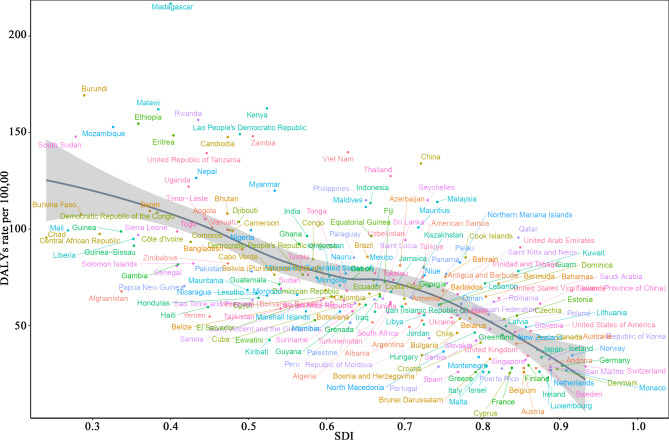
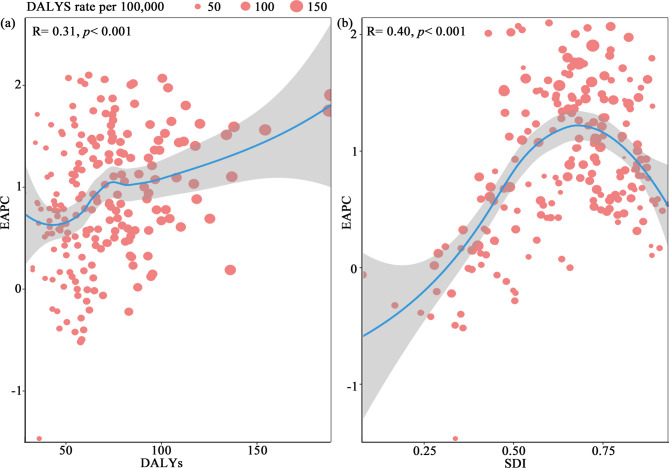
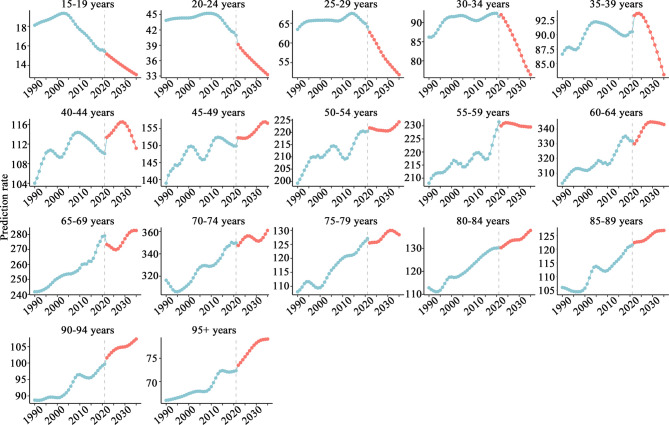
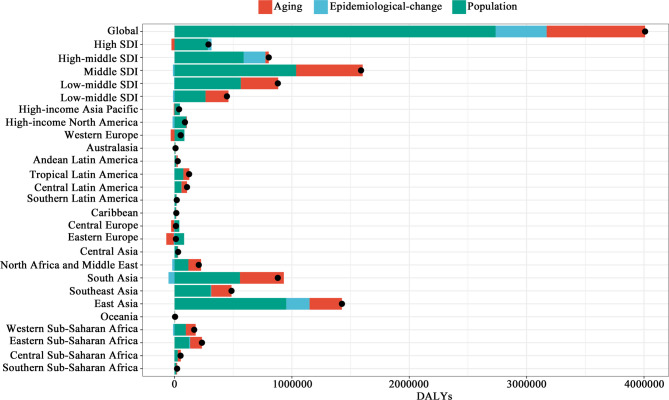
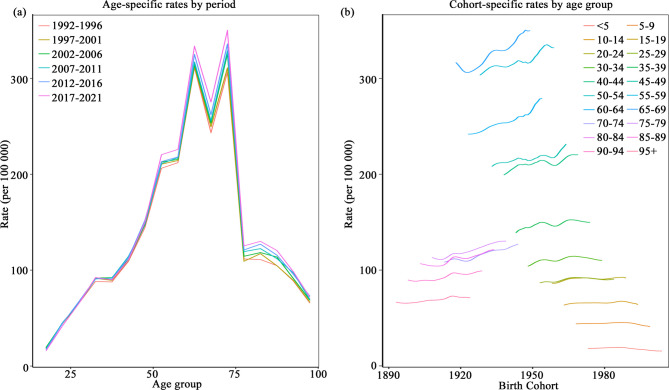
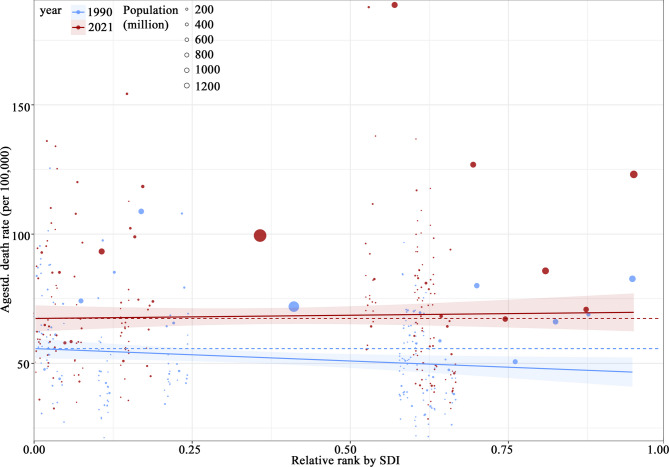
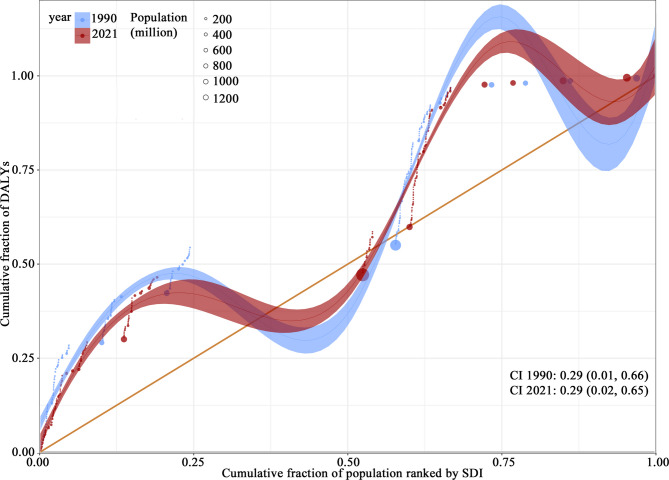
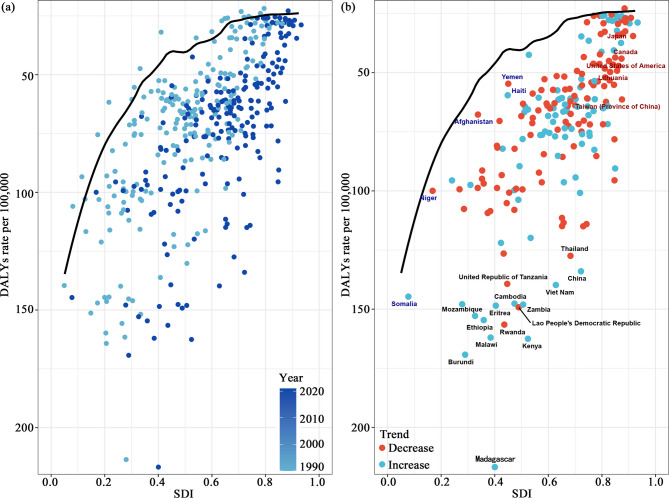
Exposure to occupational noise has emerged as a major health issue worldwide. To better evaluate changes in the health impacts of occupational noise exposure from 1990 to 2021, this study conducted stratified analyses of spatiotemporal variations across regions, genders, age, and sociodemographic index (SDI) levels. Results indicate that low-income and rapidly industrializing countries bear higher burdens of occupational noise-related diseases. Males and middle-aged to elderly populations are the primary high-risk groups for occupational noise exposure, with a particularly notable increase in the burden among those aged 45-74. Disability-adjusted life years (DALYs) significantly decreased with increasing SDI, while estimated annual percentage change (EAPC) showed significant positive correlations with both DALYs (R = 0.3) and SDI (R = 0.4). Regions with an SDI of 0.4-0.6 experienced the most pronounced EAPC growth. By 2035, DALYs rates are projected to decrease to 125.0 ± 1.9 per 100,000, although the burden for individuals aged 65 and above is expected to increase significantly. Population growth and aging were identified as key drivers of DALYs increases, contributing 68.2% and 20.9%, respectively. From 1990 to 2021, the slope inequality index changed from - 9.6 to 2.5, and the concentration index curve became smoother. Although health inequality has improved, the disease burden in low-SDI countries remains significantly higher than theoretical minimum levels. This study provides robust support for reducing global occupational noise exposure and its associated health inequalities.
Keywords: Age-period-cohort analysis; Disability-adjusted life years; Efficiency frontier model; Health inequality; Occupational noise; Population aging and growth.
© 2025. The Author(s).
Conflict of interest statement
Declarations. Competing interests: The authors declare no competing interests.
Figures


Similar articles
-
The global burden of stroke attributable to high alcohol use from 1990 to 2021: An analysis for the global burden of disease study 2021.PLoS One. 2025 Jul 14;20(7):e0328135. doi: 10.1371/journal.pone.0328135. eCollection 2025. PLoS One. 2025. PMID: 40658674 Free PMC article.
-
Global pattern, trend and cross-country inequalities of inguinal, femoral, and abdominal hernia among individuals aged 60 and above from 1990 to 2021 and projections until 2040: a population-based study.Surg Endosc. 2025 Jul;39(7):4335-4344. doi: 10.1007/s00464-025-11810-5. Epub 2025 May 28. Surg Endosc. 2025. PMID: 40437076
-
Global Burden of Musculoskeletal Disorders in Adults Aged 50 and Over, 1990-2021: Risk Factors and Sociodemographic Inequalities.J Cachexia Sarcopenia Muscle. 2025 Aug;16(4):e70008. doi: 10.1002/jcsm.70008. J Cachexia Sarcopenia Muscle. 2025. PMID: 40637061 Free PMC article.
-
Burden of inflammatory bowel disease among elderly, 1990-2019: A systematic analysis based on the global burden of disease study 2019.Autoimmun Rev. 2025 Jan 31;24(2):103708. doi: 10.1016/j.autrev.2024.103708. Epub 2024 Nov 23. Autoimmun Rev. 2025. PMID: 39586389
-
Interventions to prevent occupational noise-induced hearing loss.Cochrane Database Syst Rev. 2017 Jul 7;7(7):CD006396. doi: 10.1002/14651858.CD006396.pub4. Cochrane Database Syst Rev. 2017. PMID: 28685503 Free PMC article.
References
-
- Chen, H., Hou, C., Zhang, L. & Li, S. Comparative study on the strands of research on the governance model of international occupational safety and health issues. Saf. Sci.122, 104513 (2020).
-
- Abidin, A. N. Z., Jusoh, M. & Zakaria, Z. Y. Simulation of noise exposure level of fire-fighters in emergency response services in Malaysia. Saf. Sci.105, 121–127 (2018).
-
- Rahmanian, M., Zare Sakhvidi, M. J., Mehrparvar, A. H., Sakhvidi, Z., Dadvand, P. & F. & Association between occupational noise exposure and diabetes: A systematic review and meta-analysis. Int. J. Hyg. Environ. Health. 252, 114222. 10.1016/j.ijheh.2023.114222 (2023). - PubMed
-
- Lichenstein, R., Smith, D. C., Ambrose, J. L. & Moody, L. A. Headphone use and pedestrian injury and death in the united states: 2004–2011. Inj. Prev.18, 287–290 (2012). - PubMed
MeSH terms
Grants and funding
LinkOut - more resources
Full Text Sources
Medical
