. 2025 Aug;26(15):3856-3888.
doi: 10.1038/s44319-025-00503-8. Epub 2025 Jul 10.

Growth phase diets diminish histone acetyltransferase Gcn5 function and shorten lifespan of Drosophila males

Affiliations

Growth phase diets diminish histone acetyltransferase Gcn5 function and shorten lifespan of Drosophila males

Shoko Mizutani et al. EMBO Rep. 2025 Aug.

Abstract

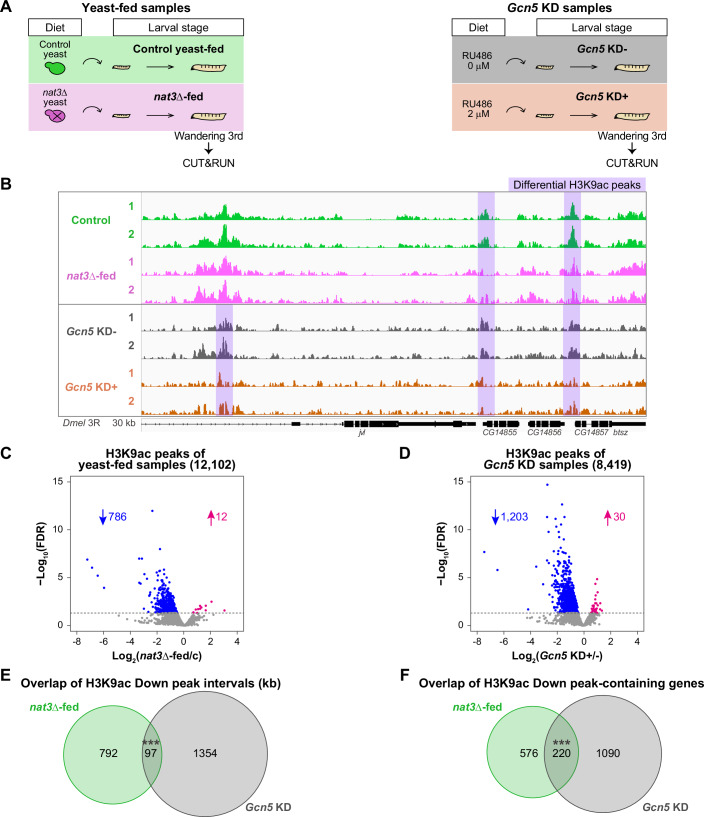
The nutritional environment in early life, referred to as the nutrition history, exerts far-reaching health effects beyond the developmental stage. Here, with Drosophila melanogaster as a model, we fed larvae on diets consisting of a variety of yeast mutants and explored the resulting histories that impacted adult lifespan. A larval diet comprised of yeast nat3 KO shortened the lifespan of male adults; and remarkably, this diet diminished the function of histone acetyltransferase Gcn5 in larvae. Concordantly, perturbation of Gcn5-mediated gene regulation in the larval whole body or neurons significantly contributed to the earlier death of adults. The nat3 KO diet is much more abundant in long-chain fatty acids and branched-chain amino acids (BCAAs) than the control yeast diet. Supplementing the control diet with a combination of oleic acid, valine, and acetic acid recapitulated the effects of the nat3 KO diet on the larval transcriptome and the lifespan of males. Our findings strongly suggest a causal link between a fatty acids- and BCAA-rich diet in developmental stages and lifespan reduction via the adverse effect on the Gcn5 function.

Keywords: BCAA; DOHaD; Fatty Acid; Gcn5; Histone Acetyltransferase.


Conflict of interest statement

Disclosure and competing interests statement. The authors declare no competing interests.

Figures

Figure 1
Figure 1. The live yeast–fly assay and the long-term effect of the nat3Δ yeast diet in larval stages on the lifespan of male adults.
(A) Designs of the live yeast–fly assay and subsequent measurements of lifespan. Larvae were fed on a control yeast strain or individual single-gene knockout yeast strains, such as Gene A KO and Gene B KO. Eclosed adults with variable nutrition histories were collected and then fed on the common standard laboratory food. Ultimately, the lifespans of those adults were recorded. See some representative characterizations of the live yeast–fly assay in Fig. EV1A–D. (B) A photo of the yeast–fly tubes in a rack. In each tube, one yeast strain was cultured on a modified synthetic complete medium for yeast (mSCM). Then, about thirty germ-free embryos of white Dahomey (wDah) were placed on top of the cultured yeast and the tube was plugged with an autoclaved cotton ball. (C) Summary of our screen from the start, with 5153 yeast strains, concluding with the isolation of two strains that changed the male adult lifespan. See details of how we isolated the 46 and the 29 yeast strains in “Methods”, Appendix Fig. S1 and Dataset EV1. (DI) Effects of the nat3Δ diet on adult eclosion (D) and male lifespan (E, F), body weight (G, H) and adult climbing ability (I). (D) Adult eclosion percentage was calculated from the daily number of eclosed adult flies of both males and females. Throughout this study, both males and females were counted for calculations of adult eclosion percentages (male:female 1:1). (E, F) Survival curves of males with the control or nat3Δ nutrition history. nat3Δ-history males died sooner than the control males in all of 10 independent experiments including those shown in (E, F). The panel (E) data is a part of the data of Appendix Fig. S2 Round 1. (G) Body weight of individual control-fed or nat3Δ-fed wandering third-instar male larvae (“c” or “n”). Each data point represents the average body weight of 13–15 larvae. (H) Body weight of control-history or nat3Δ-history male adults of two ages (“c” or “n”). Each data point represents the weight of a single adult. (I) The total number of control male adults (green, “c”) was 30 (3 vials) and those of nat3Δ history (pink, “n”) was 26 (3 vials) at each age. Boxplots are depicted as in “Statistical analysis” in “Methods”. *P < 0.05, **P < 0.01, ***P < 0.001. The exact P values, sample sizes (N), and statistical tests employed are listed in Dataset EV12. Source data are available online for this figure.
Figure 2
Figure 2. Striking similarity of gene expression profiles between the nat3Δ-fed male larvae and larvae with a Gcn5 histone acetyltransferase gene mutation.
(A) Experimental designs for omics of the two yeast strains (the control strain and nat3Δ, colored green and pink, respectively), the two respective yeast-fed wandering third-instar larvae, and adults of the indicated ages that were endowed with the respective nutrition histories. The larvae and adults were reared as in Fig. 1A,B. The number of differentially expressed genes between the control yeast-fed larvae and the nat3Δ-fed male larvae was 1120 (693 up and 427 down in nat3Δ-fed), which decreased to 223 in the young male adults (121 up and 102 down in nat3Δ history) and 165 in the midlife male adults (39 up and 126 down in nat3Δ history). (BG) Comparison of our RNA-seq data from the yeast-fed male larvae, the microarray data from Gcn5 or Ada2a mutant larvae (Carré et al, 2008) and the microarray data of double mutant larvae of Kdm4A and Kdm4B (Tsurumi et al, ; designated as Kdm4 mutant). These microarray data were collected presumably from larvae of both the sexes. Kdm4 gene encodes histone lysine demethylase 4, and Kdm4A and Kdm4B reverse tri-methylation of H3K9 and H3K36 (Lloret-llinares et al, 2008). (B, D, F) Heatmaps showing whether each of significantly upregulated (Up) and downregulated (Down) genes in the nat3Δ-fed male larvae (red and blue, respectively, in “nat3Δ-fed|control”) tends to be up or down in the Gcn5 or Ada2a mutant larvae (red or blue in “Gcn5-/-|control” in (B) and in “Ada2a-/-|control” in (D)). Because the available microarray data of the Kdm4 mutant larvae contains only Up and Down genes in the mutant, panel F shows whether each of the Up and Down genes in the mutant (red and blue, respectively in “Kdm4|control”) tends to be up or down in the nat3Δ-fed male larvae (red or blue in “nat3Δ-fed|control”). (C, E, G) Venn diagrams showing overlaps between the Up or Down genes in the nat3Δ-fed male larvae and the Up or Down genes in the Gcn5 mutant larvae (C), Ada2a mutant larvae (E) or Kdm4 mutant larvae (G). The numbers of genes in the individual categories are indicated. Changes in gene expression were highly correlated between the nat3Δ-fed male larvae and the Gcn5 mutant larvae, and also between nat3Δ-fed male larvae and the Ada2a mutant larvae [κGcn5 = 0.92 (95% CI: 0.87–0.97) and κAda2a = 0.87 (95% CI: 0.83–0.92); Cohen’s kappa coefficient]. However, the correlation was low between the nat3Δ-fed male larvae and the Kdm4 mutant larvae [κKdm4 = 0.015 (95% CI: −0.063–0.094)]. We prepared triplicates for the respective conditions of this RNA-seq analysis (Dataset EV4). Source data are available online for this figure.
Figure 3
Figure 3. Genome-wide profile of H3K9 acetylation in the nat3Δ-fed male larvae and its similarity to that of Gcn5 KD male larvae.
(A) Experimental designs for preparing wandering 3rd-instar male larvae of “Yeast-fed samples” and “Gcn5 KD samples” for CUT&RUN analysis. (Left) The larvae of “Yeast-fed samples” (Control and nat3Δ-fed) were reared as in Fig. 1B to examine the dietary effect. (Right) “Gcn5 KD samples” (“Gcn5 KD−” and “Gcn5 KD + ”) were prepared to examine the effect of knocking down Gcn5 broadly in larvae. Larvae with a DaGS driver and a short-hairpin RNA construct were reared on the standard food without or with an RNAi-inducing drug, RU486. See details in “Methods”. (B) Local views illustrating acetylation of histone H3K9 (H3K9ac) in a 30 kb genomic region. The four conditions are labeled as in (A), and two replicates per condition are shown. Shaded regions show differential peaks between the dietary conditions (Control vs. nat3Δ-fed) and/or between the Gcn5 KD conditions (Gcn5 KD− vs. Gcn5 KD + ). (C, D) Volcano plots showing how H3K9ac peaks are altered between the two dietary conditions (C) and between the Gcn5 KD conditions (D). A total of 12,102 H3K9ac peaks were identified in the yeast-fed samples (C), whereas 8419 peaks were identified in the Gcn5 KD samples (D). Reduced and increased peaks are colored blue and magenta, respectively. The numbers of peaks for individual categories are indicated. (E) A Venn diagram showing the overlap of the H3K9ac Down peaks between the dietary conditions and those between the Gcn5 KD conditions. The cumulative peak intervals (kb) for individual categories are indicated. The overlap (97 kb of peak intervals) was significant. See details in Dataset EV6. (F) A Venn diagram showing the overlap of the Down peak-containing genes between the dietary conditions and those between the Gcn5 KD conditions. The numbers of peaks for individual categories are indicated. The overlap was significant (220 genes: 28% of the nat3Δ-fed down peak-containing genes). We prepared H3K9ac duplicates and an IgG replicate for the respective conditions of this CUT&RUN analysis as explained in “Methods”. *P < 0.05, **P < 0.01, ***P < 0.001. The exact P values, sample sizes and statistical tests employed are listed in Dataset EV12. Source data are available online for this figure.
Figure 4
Figure 4. Effects on male adult lifespan of larval-stage whole-body or tissue-specific Gcn5 knockdowns.
(A) Experimental designs for collecting adults that either experienced a partial gene knockdown (KD) in larval stages (KD + ; RU486, 2 μM) or did not (KD-; RU486, 0 μM), with subsequent monitoring of adult lifespan with full gene expression restored. Larval stage-selective gene KD was conducted essentially as depicted in the righthand side of Fig. 3A. Here, Gcn5 or other genes were knocked down either broadly using DaGS (BG) or in pan-neurons, the gut plus fat body, and the Malpighian tubule using ElavGS, TIGS, and UroGS, respectively (HN). (B, C) RT-qPCR to quantify Gcn5 transcript levels in male larvae (B) and in male adults (C). (B) Results in larvae with the respective genotypes for whole-body knockdowns using shRNAs targeting mCherry or Gcn5. “−” (gray) indicates no induction of short hairpin RNA expression, whereas “+” (orange) indicates the induction of shRNA by RU486. (C) The Gcn5 transcript level in adults was not altered whether Gcn5 had been knocked down in larval stages or not. (DG) Effects of larval-stage whole-body KD of the indicated genes on adult eclosion (D, E) and male lifespan (F, G). (D, E) Adult eclosion percentage was calculated from the daily number of eclosed male and female adults. (F, G) Survival curves of male adults with or without the respective KD history in larval stages. The data of (BG) were obtained in a set of experiments. The negative effects of larval-stage Gcn5 KD on adult eclosion and male lifespan were reproduced in two more independent experiments. (HN) Effects of the tissue-specific Gcn5 KD in larval stages on adult eclosion (HJ), climbing ability of two-week-old male adults (K) and male lifespan (LN). (HJ) Adult eclosion percentage was calculated from the daily number of eclosed male and female adults. (K) The data for 4H-4K were obtained in a set of experiments. See details in “Methods”. None of the Gcn5 KD conditions decreased the number of emerging adults, whereas KD in larval neurons caused a 1-day delay in the timing of the adult emergence and a severe decline in motor performance of the adults. (LN) Survival curves of male adults with Gcn5 KD history in larval neurons (L), in the larval intestine plus the adipose tissue (M), and in larval Malpighian tubules (N). The data of L-N were obtained in a set of experiments. Shorter lifespan phenotype of male flies with the neuronal Gcn5 KD history was reproduced in one more independent experiment. (O) RNA-seq analysis of the adult brain of males reveals a long-term effect of the nat3Δ diet in larval stages on gene expression in the adult brain. (Left) Out of a total of 8941 genes expressed in the brain, the expression of 8309 genes was unaffected whether the larval diet was the nat3Δ yeast or the control yeast (“Not changed,” light purple). Colored green or pink are genes whose log2 fold change between the control history adults and the nat3Δ history adults [log2(nat3Δ history/c)] was smaller than −0.5 (green) or larger than 0.5 (pink). (Right) We prepared triplicates for the respective conditions of this RNA-seq analysis (Dataset EV7). Boxplots are depicted as in “Statistical analysis” in “Methods”. *P < 0.05, **P < 0.01, ***P < 0.001. The exact P values, sample sizes and statistical tests employed are listed in Dataset EV12. Source data are available online for this figure.
Figure 5
Figure 5. Abundance of fatty acids and amino acids in the nat3Δ diet and effects of supplementations of oleic acid, valine and acetic acid to larval diets on male lifespan.
(A) Heatmaps showing relative abundance of C10-C29 fatty acids in the control yeast and the nat3Δ strain. (Top) Abundances of five long-chain fatty acids (C16 and C18) were determined using gas chromatography-mass spectrometry (GC-MS) split mode. (Bottom) Other fatty acids, including very-long-chain fatty acids were measured by GC-MS, splitless mode. The amounts of all detected fatty acids were significantly increased in the nat3Δ yeast. (B) Log2 fold changes in amino acid amounts between the control yeast and nat3Δ yeast that were obtained on MetaboAnalyst analysis of the liquid chromatography-tandem mass spectrometry (LC-MS/MS) data. The purple bars indicate changes in essential amino acids (EAA) for Drosophila, whereas the light purple ones indicate those of non-essential amino acids (NEAA). One BCAA, valine, was the most elevated in the nat3Δ yeast. (CF) Effects of nutrition histories, when supplemented with 0.5% (C) or 1% (D) oleic acid (“Ole”) alone, with valine (“Val”) alone (E), or with both together (F), on male lifespan. Survival curves of the males with the respective nutrition histories. Control larvae were fed on the live control yeast and the agar medium (mSCM) containing Tween 80 (the control diet) and developed to adults (sky blue). The data of the experimental groups are colored in gray. (G) The enzymatic reaction of Acetyl-coenzyme A synthase (AcCoAS): acetic acid is consumed to produce acetyl-CoA in the cytoplasm. (H) Expression values (transcripts per million; TPM) of AcCoAS in the control yeast-fed larvae (green, “c”) and the nat3Δ-fed larvae (pink, “n”). (IK) Effects of adding acetic acid (“Ace”) alone (I), or acetic acid and oleic acid (J), or the three nutrients, oleic acid, valine, and acetic acid, together (K) to the control nutrition history on male lifespan. Control larvae were fed on the same control diet as in (CF) (sky blue). (L) Relative amounts of acetic acid in the liquid culture media (“Extracellular”) and in the yeast cells (“Intracellular”) of the control or nat3Δ yeast strain (“c” or “n”). The vertical axes show corrected peak areas by OD600 values or raw values from liquid chromatography-mass spectrometry (LC-MS). Boxplots are depicted as in “Statistical analysis” in “Methods”. *P < 0.05, **P < 0.01, ***P < 0.001. The exact P values, sample sizes and statistical tests employed are listed in Dataset EV12. Source data are available online for this figure.
Figure 6
Figure 6. Strong similarities of gene expression profiles between the OVA-fed male larvae and the nat3Δ-fed male larvae or the Gcn5 mutant larvae.
(A) Venn diagrams showing overlaps between the Up genes in the OVA-fed male larvae and the Up genes in the nat3Δ-fed (A) or the respective Down genes (B). Both the overlaps were significantly large (527 genes: 76% of the nat3Δ-fed Up genes and 295 genes in 69% the nat3Δ-fed Down genes). (CH) Comparison of our RNA-seq data from the OVA-fed male larvae, the microarray data from Gcn5 or Ada2a mutant larvae (Carré et al, 2008), and the microarray data of Kdm4A and Kdm4B double-mutant larvae (Tsurumi et al, ; designated as Kdm4 mutant). These microarray data were collected presumably from larvae of both the sexes. (C, E, G) Heatmaps showing whether each of the significantly upregulated (Up) and downregulated (Down) genes in the OVA-fed male larvae (red and blue, respectively, in “OVA-fed|control”) tend to be up or down in the Gcn5 or Ada2a mutant larvae (red or blue in “Gcn5-/-|control” in panel C and “Ada2a-/-|control” in (E)). Because the available microarray data of the Kdm4 mutant larvae contains only Up and Down genes in the mutant, panel G shows whether each of the Up and Down genes in the mutant (red and blue, respectively in “Kdm4|control”) tends to be up or down in the OVA-fed male larvae (red or blue in “OVA-fed|control”). (D, F, H) Venn diagrams showing overlaps between the Up or Down genes in the OVA-fed male larvae and the Up or Down genes in the Gcn5 mutant larvae (D), Ada2a mutant larvae (F), or Kdm4 mutant larvae (H). The numbers of genes in the individual categories are indicated. Changes in gene expression were highly correlated between the OVA-fed male larvae and the Gcn5 mutant larvae, and also between OVA-fed larvae and the Ada2a mutant larvae [κGcn5 = 0.85 (95% CI: 0.79–0.91) and κAda2a = 0.93 (95% CI: 0.9–0.96); Cohen’s kappa coefficient]. By contrast, the correlation was low between the OVA-fed male larvae and the Kdm4 mutant larvae [κKdm4 = 0.0089 (95% CI: −0.09–0.11)]. Because we show that both the transcriptomic data of the nat3Δ-fed larvae and that of the OVA-fed larvae show significantly similarities to that of Gcn5 mutant (Figs. 2B–E and 6C–F, respectively), we listed the overlapped Up/Down genes among the three datasets in Dataset EV9C. We prepared triplicates for the respective RNA-seq conditions (Dataset EV9). The exact P values, sample sizes and statistical tests employed are listed in Dataset EV12. Source data are available online for this figure.
Figure 7
Figure 7. Genome-wide profile of H3K9 acetylation in the OVA- or OV-fed male larvae and quantities of CoA-related metabolites in the nat3Δ-fed male larvae.
(AC) CUT&RUN analyses of male larvae fed on the control diet, a control diet supplemented with oleic acid, valine and acetic acid (OVA), or a control diet supplemented with oleic acid and valine (OV). (A, B) Volcano plots showing the relative effects of either diet on H3K9ac peaks. Reduced and increased peaks are colored blue and magenta, respectively. (C) Venn diagrams showing the overlaps of the Down peak-containing genes between the OVA-diet condition and either the nat3Δ-diet condition or the Gcn5 KD condition. The numbers of peaks for individual categories are indicated. We prepared H3K9ac duplicates and an IgG replicate for the respective conditions of these CUT&RUN analyses as explained in “Methods”. (DG) Concentrations (ng/mg larval weight) of acetyl-CoA (D), CoA (E), and long chain fatty acyl-CoA species (G), and calculations of acetyl-CoA|CoA ratios for individual replicates (F) in the control or nat3Δ-fed larvae (“c” or “n”). Boxplots are depicted as in “Statistical analysis” in “Methods”. *P < 0.05, **P < 0.01, ***P < 0.001. The exact P values, sample sizes and statistical tests employed are listed in Dataset EV12. (H) A model of the long-term effect of the nat3Δ diet or the OVA diet on adult lifespan. The nat3Δ yeast is rich in long-chain fatty acids including oleic acid, a branched-chain amino acid valine; and (an) unidentified additional key nutrient(s). In the nat3Δ-fed larvae, gene expression suggests that fatty acid degradation, valine degradation and fatty acid synthesis are enhanced simultaneously, which causes a reduction in the nucleocytoplasmic acetyl-CoA level relative to CoA-related compounds such as CoA, propionyl-CoA (not measured) and long-chain acyl-CoA species. In the OVA-fed larvae, similar changes in the metabolism are assumed by the gene expression while we did not measure their amounts or ratios. This altered metabolism in either set of larvae diminishes the histone acetyltransferase Gcn5 function, which is proposed to result in a shorter adult lifespan. Source data are available online for this figure.
Figure EV1
Figure EV1. Characterization of the live yeast–fly assay.
(A, B) Effects of the two distinct foods in larval stages on adult eclosion (A) and male lifespan (B): the modified synthetic complete medium (mSCM) plus live yeast (BY4741) in our live yeast–fly assay and LSF. (A) The numbers of emerging adults were much fewer on the live yeast diet (“Live yeast history”) than on LSF (“LSF history”). In contrast to this major difference in the effect on the development, the difference in the lifespan was quite minor (B). These results indicate that our live yeast diet provides a less favorable environment for development compared to LSF, but the eclosed adults live essentially as long as the adults that developed on LSF from the very beginning of the larval stage. Adult eclosion percentage was calculated from the daily number of eclosed male and females. (C, D) Effects of amounts of live yeast (BY4741) on adult eclosion (C) and male lifespan (D). 40 μl of yeast suspensions with three different concentrations [1/2x, 1× (~8 × 10⁸ cells/ml) and 2x] were added to each mSCM tube, and these tubes were cultured at 30 °C for 2 days before addition of germ-free fly embryos. Neither half nor double the quantity of live yeast produced a significantly different effect on larval development or on adult lifespan. These results suggest that differences in the growth of yeast single-gene KO strains on mSCM, if they are within the range tested here, do not affect development or lifespan. Adult eclosion percentage was calculated from the daily number of eclosed male and females. (E) The nat3Δ diet in larval stages did not affect female lifespan. *P < 0.05, **P < 0.01, ***P < 0.001. The exact P values sample sizes and statistical tests employed are listed in Dataset EV12. Source data are available online for this figure
Figure EV2
Figure EV2. Other characterizations of RNA-seq and CUT&RUN data related to the nat3Δ-fed male larvae and the Gcn5 knockdown male larvae.
(A) Expression values (transcripts per million; TPM) of ATAC complex genes, including Gcn5 and Ada2a, and other lysine acetyltransferase (KAT) genes in our larval whole-body RNA-seq data. None of the gene expressions examined were significantly different between the control and nat3Δ diets. We did this analysis because we assumed that feeding the nat3Δ diet partially diminished Gcn5 function in larvae on the basis of the data of Fig. 2B-2E, prompting us to ask whether any subunit genes of the ATAC complex were downregulated or not. The data of Gcn5 and Ada2a (rightmost) are shown in the graph and that of other subunit genes (Torres-Zelada and Weake, ; Dent, 2024) are not shown. The other 9 genes in the graph encode Drosophila KATs, whose preferred target lysine residues in histones have been studied by mass spectrometry (Feller et al, 2015). (B) Breakdown of 9199 H3K9ac peak-containing genes of yeast-fed larvae. 86% are expressed in our RNA-seq data. 5 genes in “NA”, His3:CG33866, His3.3A, His3.3B, His4r and DIP1, are not included in our RNA-seq annotation gene list. (C) H3K9ac profiles around TSS of the Down peak-containing genes of the nat3Δ-fed larvae (top) and those of Gcn5 KD+ larvae (bottom). The profiles of the individual H3K9ac replicates are shown. Boxplots are depicted as in “Statistical analysis” in “Methods”. The exact P values, sample sizes and statistical tests employed are listed in Dataset EV12. Source data are available online for this figure
Figure EV3
Figure EV3. Elevated gene expression of the fatty acid degradation pathways and branched-chain amino acid (BCAA) degradation pathways in the nat3Δ-fed male larvae.
(A) β-Oxidation pathways of saturated fatty acids in mitochondria and peroxisomes, and representative enzymes that are conserved between Drosophila and mammals. (BE) Gene expression values (TPM) of 4 groups of the fatty acid degradation pathways in our RNA-seq data from the control yeast-fed larvae (green, “c”) and nat3Δ-fed larvae (pink, “n”): acyl-CoA dehydrogenase genes (B), acyl-CoA oxidase genes (C), long-chain fatty acyl-CoA binding protein genes (D), and other genes including a 3-ketoacyl-CoA thiolase (acetyl-CoA acyltransferase) gene, yip2, and an acyl-CoA synthetase gene, CG3961 (E). Most of the genes shown here were upregulated in the nat3Δ-fed larvae, whereas CG4860 in (B) and CG8629 in (D) were downregulated. In each group, genes whose expression levels were not different (ns) between the control yeast-fed larvae and the nat3Δ-fed larvae or not detected (undetected) are the following: CG7461 (ns) and Arc42 (ns) in group B; CG5009 (ns) and CG4586 (ns) in group C; CG8498 (ns), CG8814 (ns), CG14232 (ns) and CG33713 (undetected) in group D. (F) BCAA degradation pathways in mitochondria of D. melanogaster that are partially shared by β-Oxidation pathways. Differentially expressed enzyme genes are shown as below: those shaded in magenta are upregulated in nat3Δ-fed larvae and/or in the OVA-fed larvae; CG4860 in sky blue is downregulated in both the nat3Δ-fed larvae and the OVA-fed larvae, and the others are upregulated only in the OVA-fed larvae (panel B; Appendix Fig. S5B,E,F). (G) Expression values (TPM) of 2 differential genes of BCAA degradation pathways in the control yeast-fed larvae (green, “c”) and the nat3Δ-fed larvae (pink, “n”). The other differential BCAA degradation genes are common with those in fatty acid degradation pathways. See panels (B, E). Boxplots are depicted as in “Statistical analysis” in “Methods”. *P < 0.05, **P < 0.01, ***P < 0.001. The exact P values, sample sizes and statistical tests employed are listed in Dataset EV12. Source data are available online for this figure
Figure EV4
Figure EV4. Effects of supplemented reagents on adult eclosion and male lifespan.
(A, B) Addition of 0.05% Tween 80 to the control yeast diet for larvae did not affect adult eclosion (A) nor male lifespan (B). Adult eclosion percentage was calculated from the daily number of eclosed male and females. (CO) Effects of supplemented reagents on adult eclosion (CG, I, KN) and male lifespan (H, J, O). Throughout this figure, control larvae (“Control”) were fed on the live control yeast and the agar medium (mSCM) containing Tween 80 and developed to adults (sky blue). The data of the experimental groups are colored in gray. Adult eclosion percentage was calculated from the daily number of eclosed adult flies of both the sexes. Abbreviations: Ole (oleic acid), Val (valine), Ile (isoleucine), Ace (acetic acid). *P < 0.05, **P < 0.01, ***P < 0.001. The exact P values, sample sizes and statistical tests employed are listed in Dataset EV12. Source data are available online for this figure
Figure EV5
Figure EV5. Abundance of short-chain fatty acids and pantothenate of the yeast strains and/or the yeast-fed male larvae, and expression of Fatty acid synthase1 (FASN1) in the larvae.
(A) Relative amounts of short-chain (C3-C6) fatty acids in the liquid culture media (“Extracellular”) and in the yeast cells (“Intracellular”) of the control or nat3Δ yeast strain (“c” or “n”). The vertical axes show corrected peak areas by OD600 values or raw values from liquid chromatography-mass spectrometry (LC-MS). (BD) Relative amounts of pantothenate in the yeast-fed larvae (B) and in the yeast strains (C). The vertical axes show peak areas that were measured in metabolome analyses (LC-MS/MS or CE-MS) and corrected by individual sample weights. Samples of either the control yeast-fed larvae or the control yeast are shown in the “c” boxplots (green), while samples of the nat3Δ-fed larvae or the nat3Δ yeast are shown in the “n” boxplots (pink). Logarithmic transformation and subsequent t test of MetaboAnalyst showed that pantothenate was significantly more abundant in the nat3Δ-fed larvae (left: P < 0.001, FDR < 0.001, right: P < 0.01, FDR = 0.064922). On the other hand, the pantothenate amount was not significantly different between the control and nat3Δ yeasts (P = 0.967). See more details in Datasets EV3 and EV5. (D) The biosynthetic pathway for CoA production. Pantothenate is first phosphorylated by pantothenate kinase (PANK). PANK is a rate-limiting enzyme in this pathway and feedback regulated by the end product, CoA, and also by acetyl-CoA and acyl-CoA species. (E) Expression values (TPM) of FASN1\CG3523 in the nat3Δ-fed larvae (pink, “n”), the OVA-fed larvae (magenta, “OVA”) and the respective controls (green, “c”; sky blue “C”). (F) Generalized enzymatic reaction of FASN1: a long-chain fatty acid and CoAs are produced from acetyl-CoAs in the cytoplasm. Boxplots are depicted as in “Statistical analysis” in Methods. *P < 0.05, **P < 0.01, ***P < 0.001. The exact P values, sample sizes and statistical tests employed are listed in Dataset EV12. Source data are available online for this figure
Figure EV6
Figure EV6. Impacts of the OVA diet or Gcn5 knockdown in larval stages on gene expression of female larvae and female lifespan.
(A, B) Survival curves of mated females (A) and virgin females (B) with or without the Gcn5 KD history in larval stages. (C, D) Survival curves of mated females (C) and virgin females (D) with or without the OVA nutrition history in larval stages. (E, F) Comparisons of gene expression between male larvae and female larvae under the Gcn5 KD condition (E) or the OVA diet condition (F). Venn diagrams showing overlaps of Up or Down genes between the sexes. The overlaps were significant in the individual comparisons and particularly large regarding the Down genes in the Gcn5 KD condition, and both the Up and the Down genes in the OVA diet condition. All these data were obtained in a set of experiments. *P < 0.05, **P < 0.01, ***P < 0.001. The exact P values, sample sizes and statistical tests employed are listed in Dataset EV12. Source data are available online for this figure

References

    1. Adeva-Andany MM, López-Maside L, Donapetry-García C, Fernández-Fernández C, Sixto-Leal C (2017) Enzymes involved in branched-chain amino acid metabolism in humans. Amino Acids 49:1005–1028 - PubMed
    1. Ahmad K, Spens AE (2019) Separate polycomb response elements control chromatin state and activation of the vestigial gene. PLoS Genet 15:1–21 - PMC - PubMed
    1. Aksnes H, Drazic A, Marie M, Arnesen T (2016) First things first: vital protein marks by N-terminal acetyltransferases. Trends Biochem Sci 41:746–760 - PubMed
    1. Albaugh BN, Arnold KM, Denu JM (2011) KAT(ching) metabolism by the tail: insight into the links between lysine acetyltransferases and metabolism. ChemBioChem 12:290–298 - PMC - PubMed
    1. Ali YO, Escala W, Ruan K, Zhai RG (2011) Assaying locomotor learning and memory deficits in Drosophila models of neurodegeneration. J Vis Exp 49:1–6 - PMC - PubMed

MeSH terms