

Local microglial activation induced and labeled in the retina in a novel subretinal hemorrhage mouse model
- PMID: 40640441
- PMCID: PMC12246455
- DOI: 10.1038/s41598-025-09007-w
Local microglial activation induced and labeled in the retina in a novel subretinal hemorrhage mouse model
Abstract
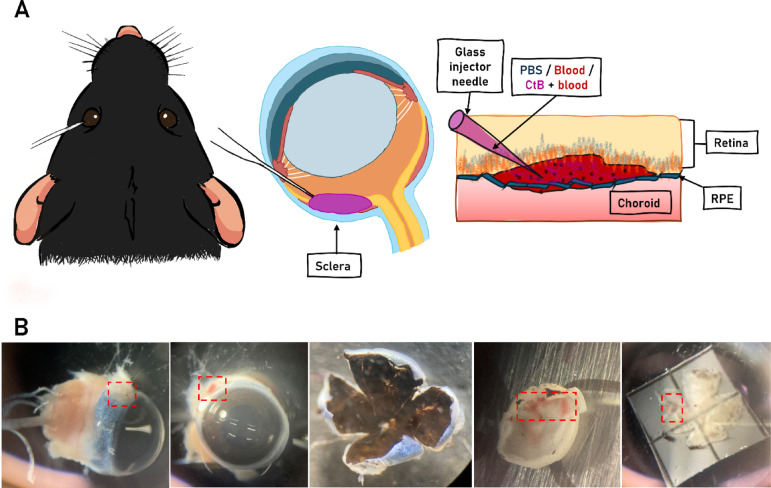
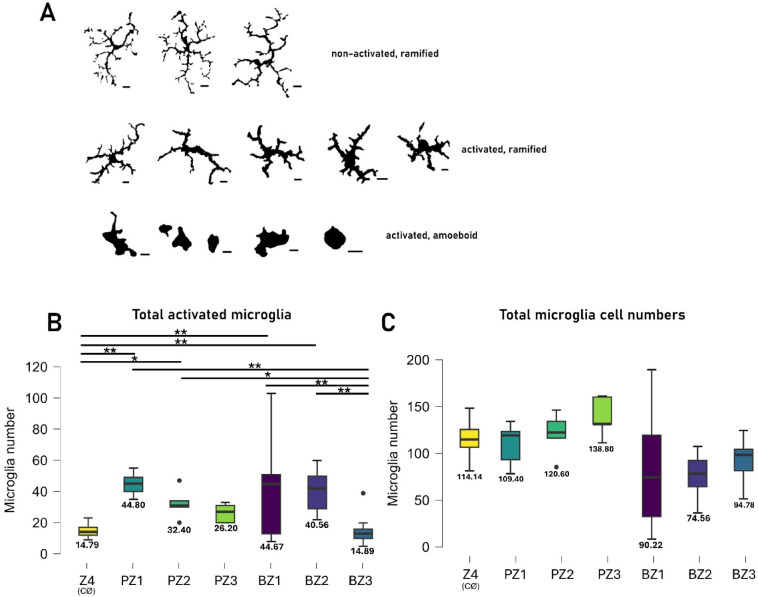
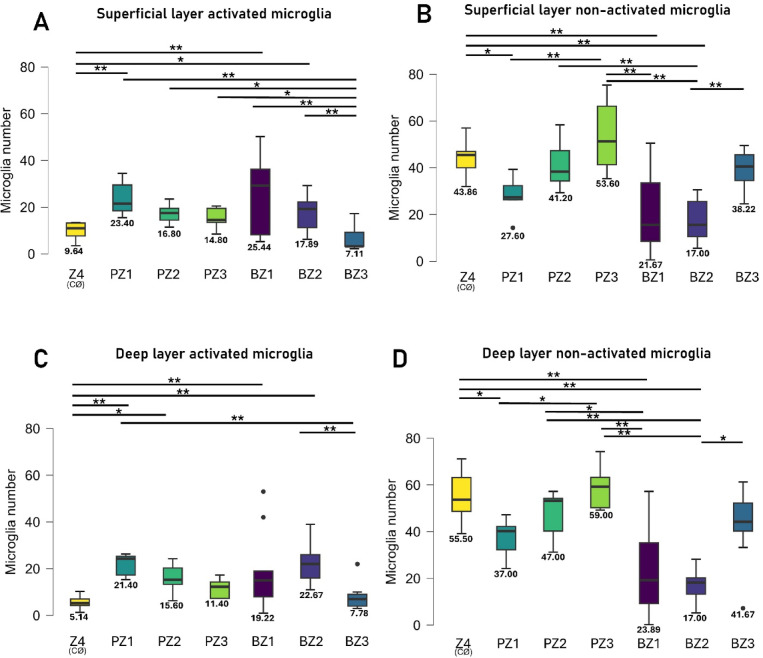
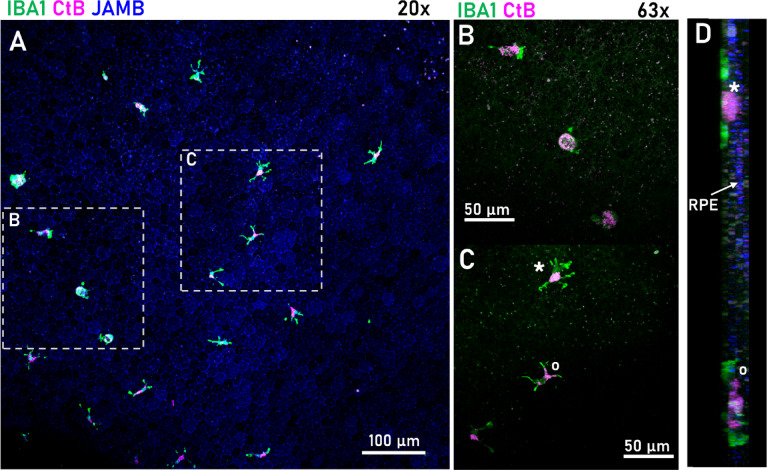
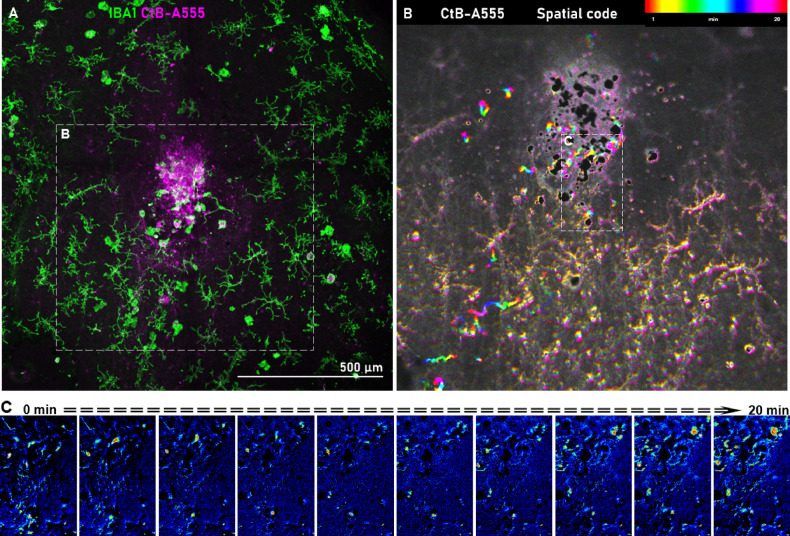
Subretinal hemorrhage (SRH) is caused by the accumulation of blood between the neurosensory retina and the retinal pigment epithelium or between the retinal pigment epithelium and the choroid. SRH often arises from age-related macular degeneration, traumas, and may occur spontaneously caused by other diseases like hypertension and diabetes. Here, we developed a novel technique - co-injection of blood and a dye-coupled tracer protein, Cholera toxin subunit B (CtB) - to better localize and understand the disease and how it can cause microglial activation, inflammation, and partial vision loss. Our results show that microglia are activated in the inner retinal layers in zones adjacent to blood injection. In contrast, the non-affected zone of the injected eye showed no microglial activation. For the first time, we used phosphate-buffered saline (PBS) injections as a control to assess the specific effects of injected blood. The results demonstrated that blood induced a markedly stronger activation response in the surrounding tissue, whereas PBS elicited a comparatively milder effect. PBS did cause microglial activation, but it was largely confined to the injection site and adjacent regions, and to a lesser extent than that observed with blood. We also observed microglial activation in the inner retina, along with the emergence of microglia and macrophages in the retinal pigment epithelium. Using advanced imaging techniques, we were able to better localize the affected area which comprises not only the immediate retinal area over the blood clot but the neighboring regions as well. These findings will provide the basis for novel therapeutic interventions targeting neuroinflammation in the retina after subretinal hemorrhage and other diseases affecting the eye.
Keywords: Bleeding; Blood; Cholera toxin; Experimental ophthalmology; Eye; Inflammation; Retinal pigment epithelium.
© 2025. The Author(s).
Conflict of interest statement
Declarations. Competing interests: The authors declare no competing interests. Ethics approval and consent to participate: All procedures conducted in accordance with the ARVO Statement for the ‘Use of Animals in Ophthalmic and Vision Research guidelines and regulations. Animal housing, handling, and all experimental procedures were approved by the ethical committee of the University of Pécs under the number BA02/2000-27/2024. All animals were treated and tested following and in accordance with the ARRIVE guidelines (arriveguidelines.org28),. All efforts were made to minimize pain and discomfort during the experiments and all procedures were done by obeying the 3R law. Consent for publication: Not applicable.
Figures


Similar articles
-
Interventions for central serous chorioretinopathy: a network meta-analysis.Cochrane Database Syst Rev. 2025 Jun 16;6(6):CD011841. doi: 10.1002/14651858.CD011841.pub3. Cochrane Database Syst Rev. 2025. PMID: 40522203
-
pTau pathology in the retina of TAU58 mice: association with ganglion cell degeneration and implications on seeding and propagation of pTau from human brain lysates.Acta Neuropathol Commun. 2024 Dec 20;12(1):194. doi: 10.1186/s40478-024-01907-8. Acta Neuropathol Commun. 2024. PMID: 39707519 Free PMC article.
-
Prophylactic non-steroidal anti-inflammatory drugs for the prevention of macular oedema after cataract surgery.Cochrane Database Syst Rev. 2016 Nov 1;11(11):CD006683. doi: 10.1002/14651858.CD006683.pub3. Cochrane Database Syst Rev. 2016. PMID: 27801522 Free PMC article.
-
Interventions for central serous chorioretinopathy: a network meta-analysis.Cochrane Database Syst Rev. 2015 Dec 22;2015(12):CD011841. doi: 10.1002/14651858.CD011841.pub2. Cochrane Database Syst Rev. 2015. Update in: Cochrane Database Syst Rev. 2025 Jun 16;6:CD011841. doi: 10.1002/14651858.CD011841.pub3. PMID: 26691378 Free PMC article. Updated.
-
Optical coherence tomography (OCT) for detection of macular oedema in patients with diabetic retinopathy.Cochrane Database Syst Rev. 2015 Jan 7;1(1):CD008081. doi: 10.1002/14651858.CD008081.pub3. Cochrane Database Syst Rev. 2015. PMID: 25564068 Free PMC article.
References
-
- London, A., Benhar, I. & Schwartz, M. The retina as a window to the brain—from eye research to CNS disorders. Nature Reviews Neurology 2012 9:1 [Internet]. 2012 Nov 20 [cited 2024 Sep 18];9(1):44–53. Available from: https://www.nature.com/articles/nrneurol.2012.227 - PubMed
-
- Rosenblatt, T. R. et al. Increasing incidence and prevalence of common retinal diseases in retina practices across the united States. Ophthalmic Surg. Lasers Imaging Retina. 52 (1), 29–36 (2021). - PubMed
-
- Morad, Y., Wygnansky-Jaffe, T. & Levin, A. V. Retinal haemorrhage in abusive head trauma. Clin Exp Ophthalmol [Internet]. 2010 Jul 1 [cited 2024 Sep 18];38(5):514–20. Available from: https://onlinelibrary.wiley.com/doi/full/10.1111/j.1442-9071.2010.02291.x - PubMed
-
- Di Marco, E. et al. A literature review of hypertensive retinopathy: systemic correlations and new technologies. Eur. Rev. Med. Pharmacol. Sci.26 (18), 6424–6443 (2022). - PubMed
-
- Murugesan, N., Üstunkaya, T. & Feener, E. P. Thrombosis and Hemorrhage in Diabetic Retinopathy: A Perspective from an Inflammatory Standpoint. Semin Thromb Hemost [Internet]. Aug 25 [cited 2024 Sep 18];41(6):659–64. Available from: http://www.thieme-connect.de/products/ejournals/html/ (2015). 10.1055/s-0035-1556731 - PMC - PubMed
MeSH terms
Substances
LinkOut - more resources
Full Text Sources
