. 2025 Aug;22(8):1686-1697.
doi: 10.1038/s41592-025-02746-8. Epub 2025 Jul 10.

De novo assembly and delivery of synthetic megabase-scale human DNA into mouse early embryos

Affiliations

De novo assembly and delivery of synthetic megabase-scale human DNA into mouse early embryos

Yue Liu et al. Nat Methods. 2025 Aug.

Abstract

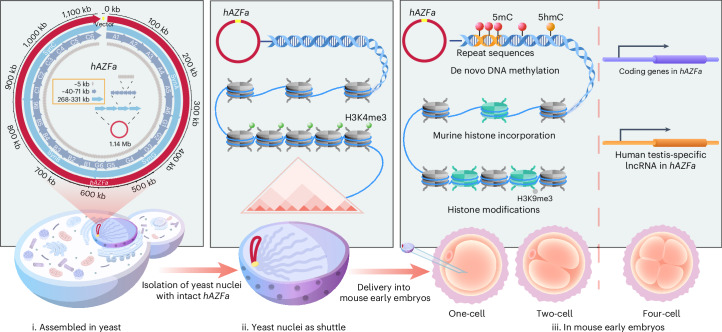
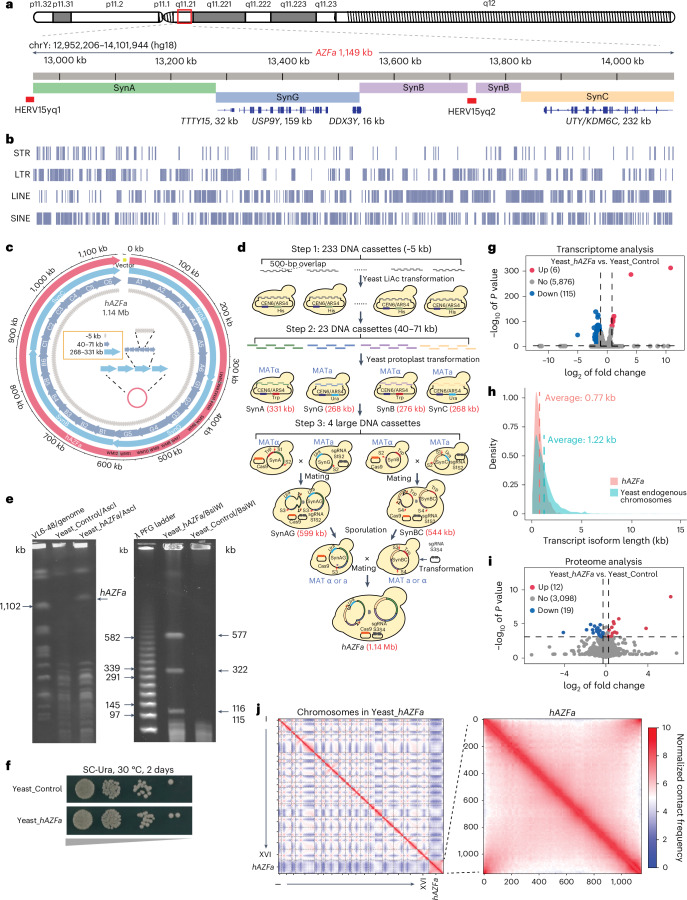
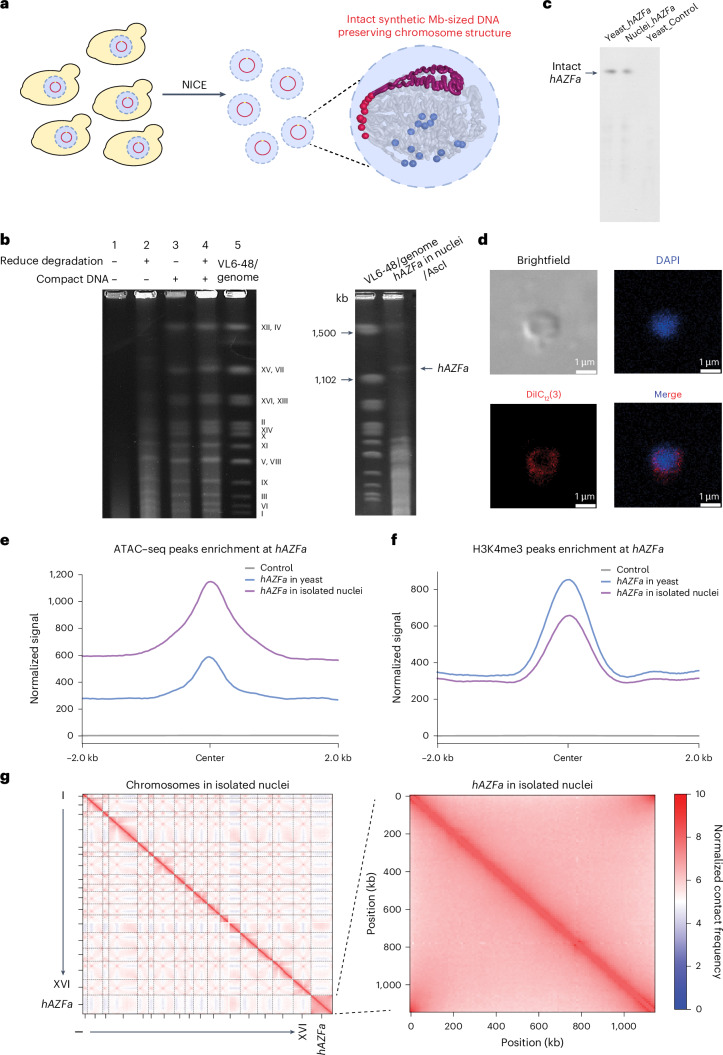
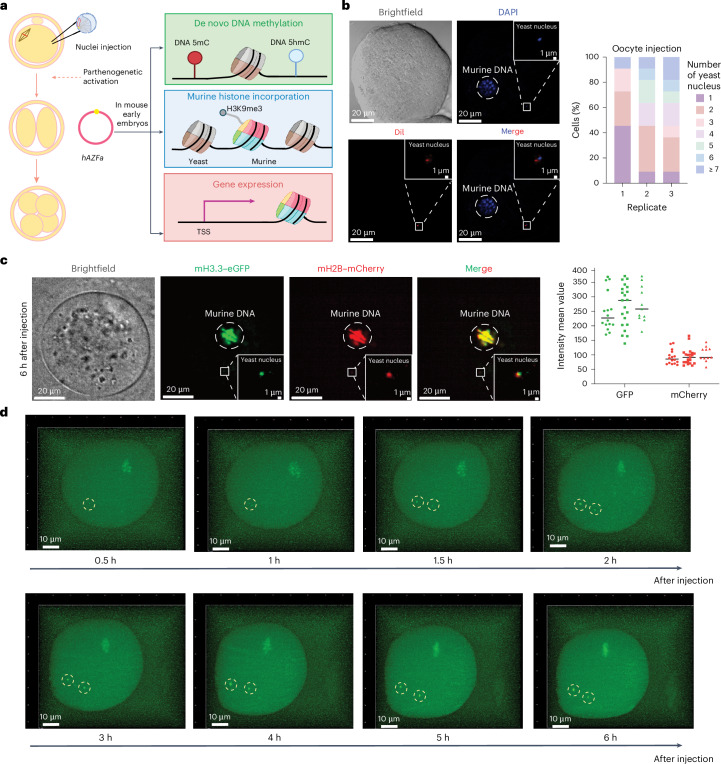
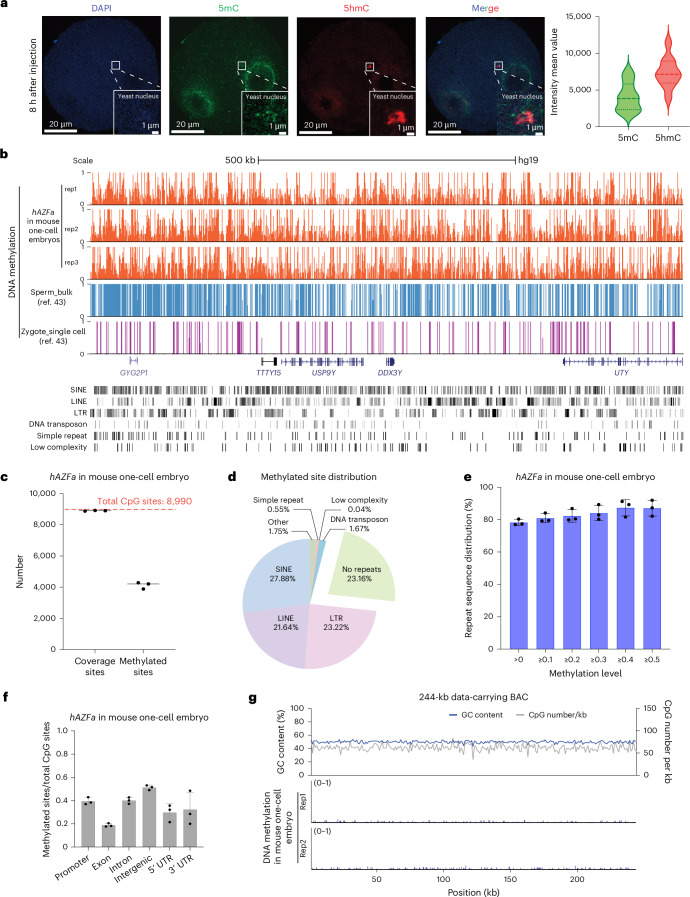
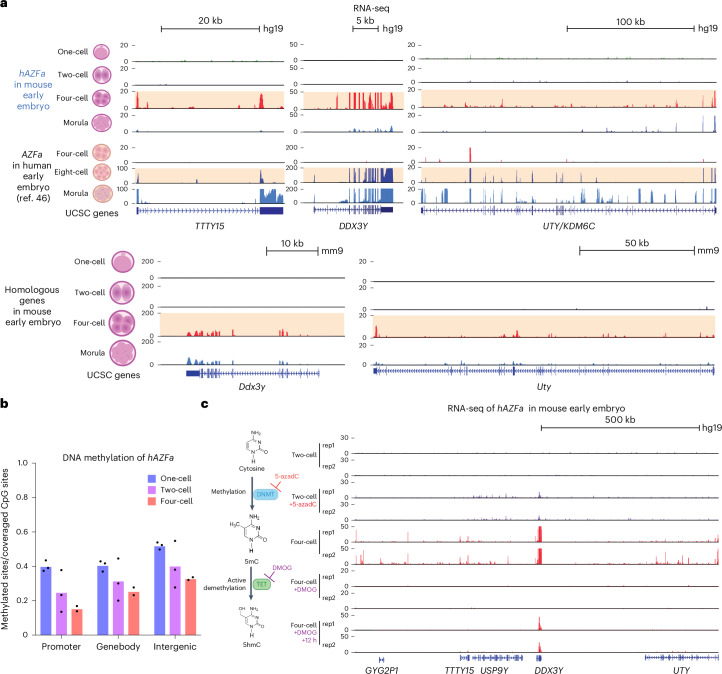
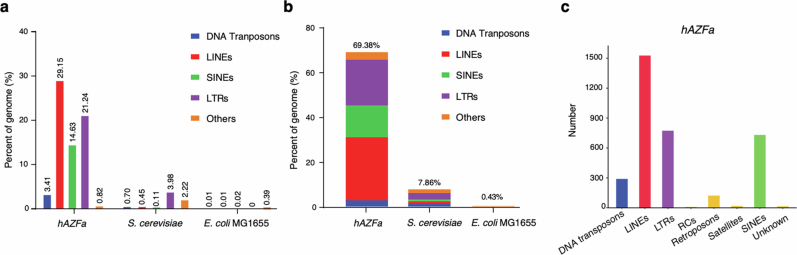
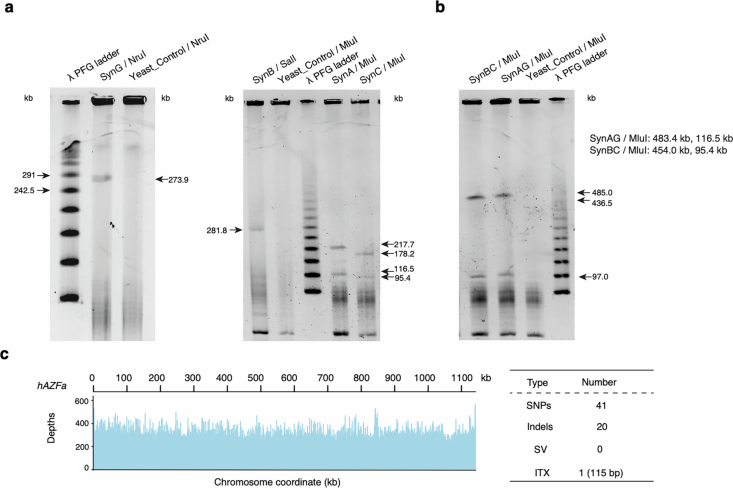
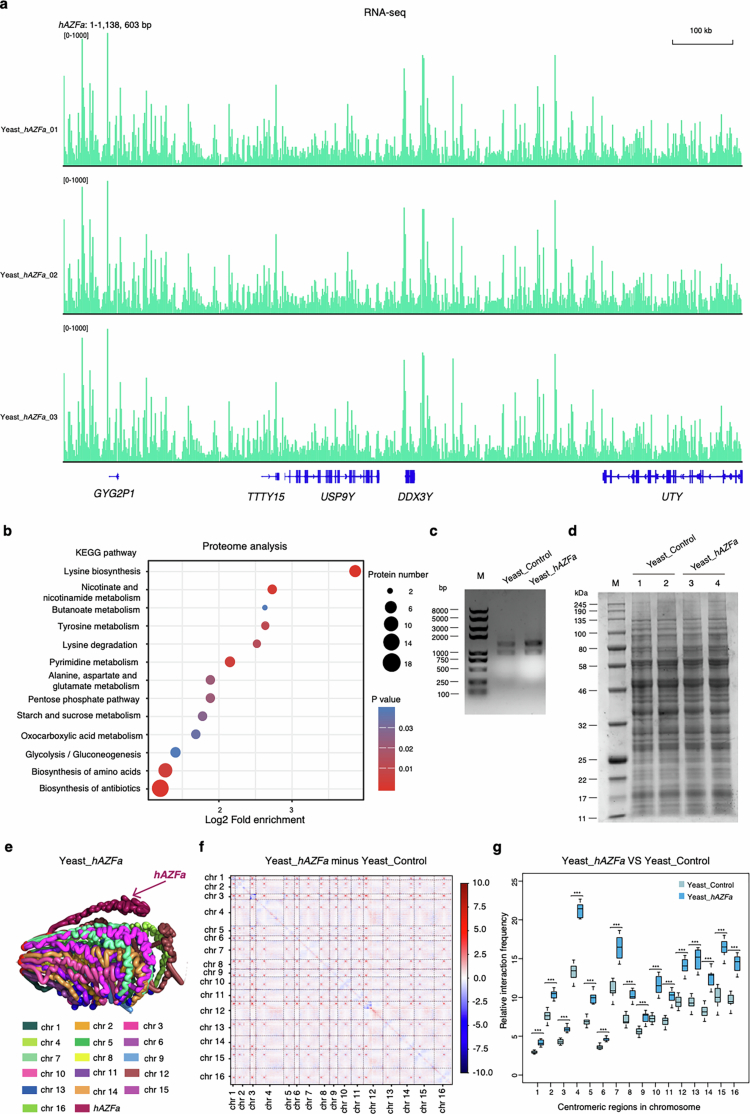
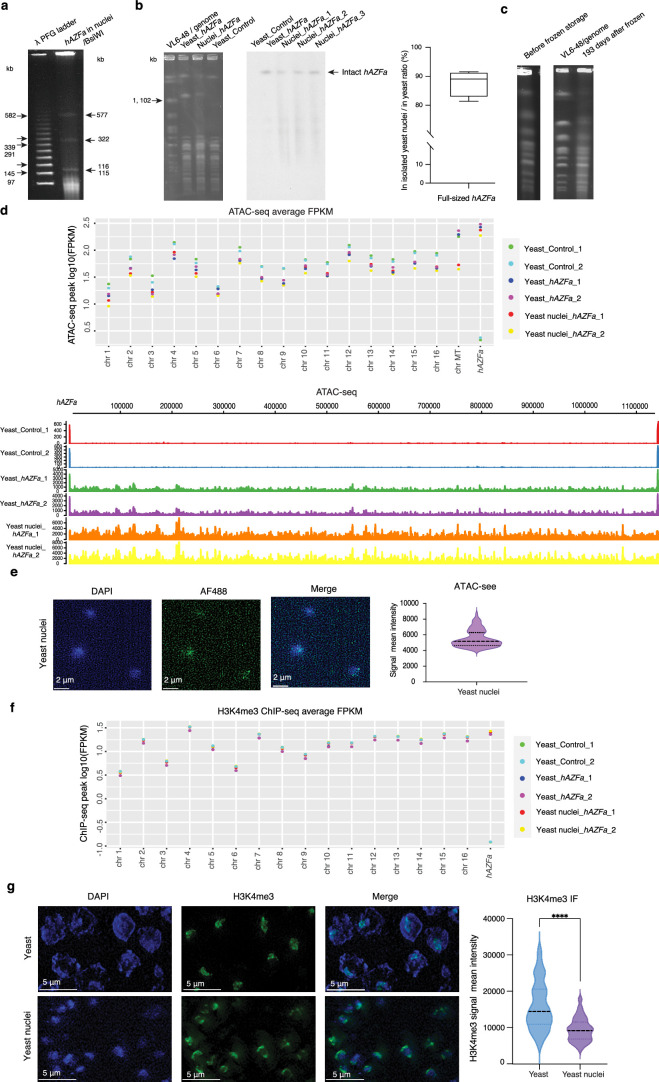
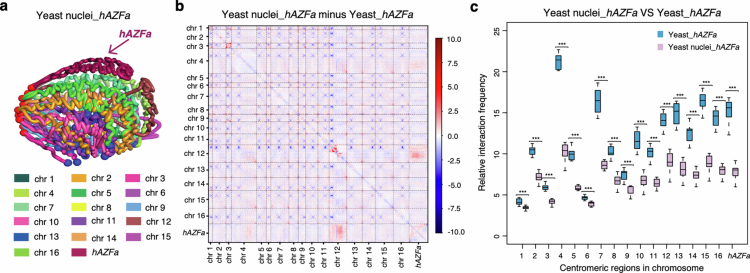
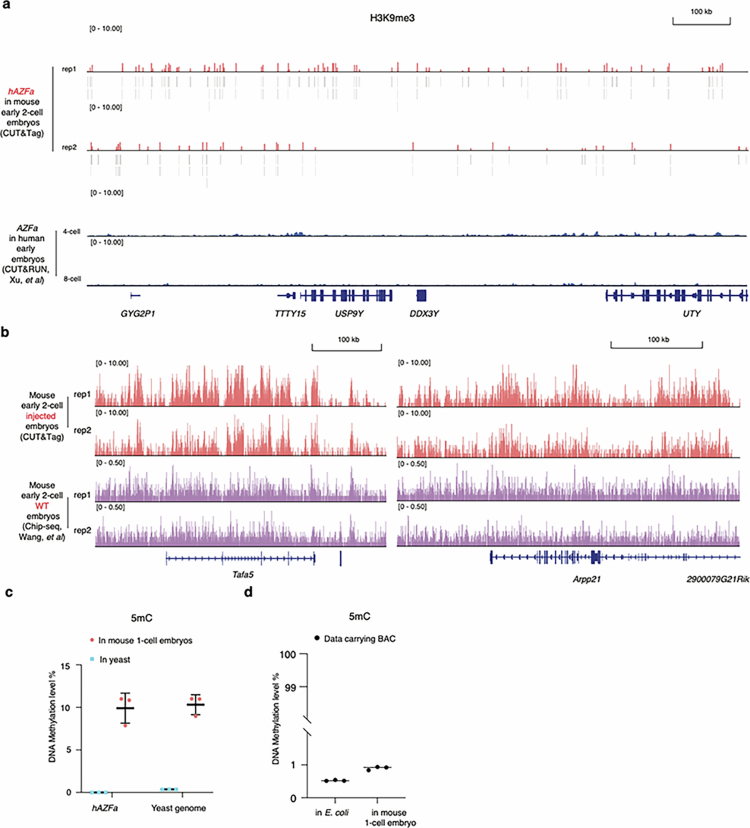
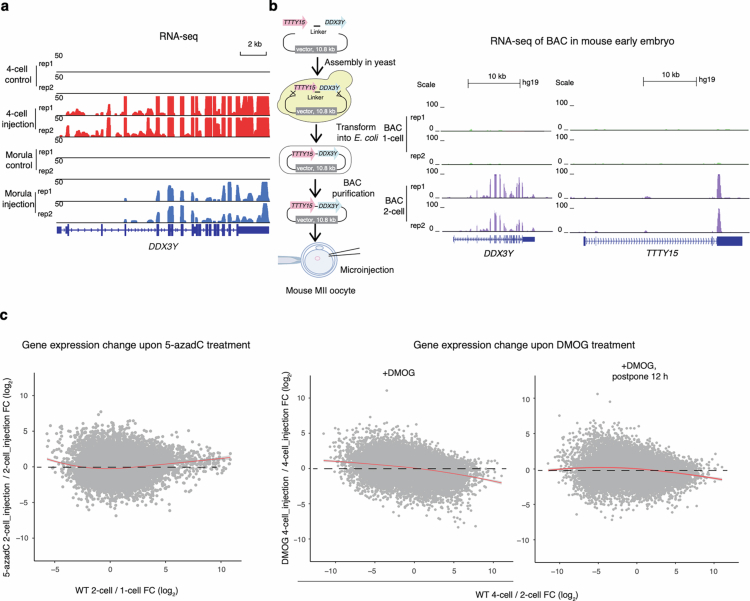
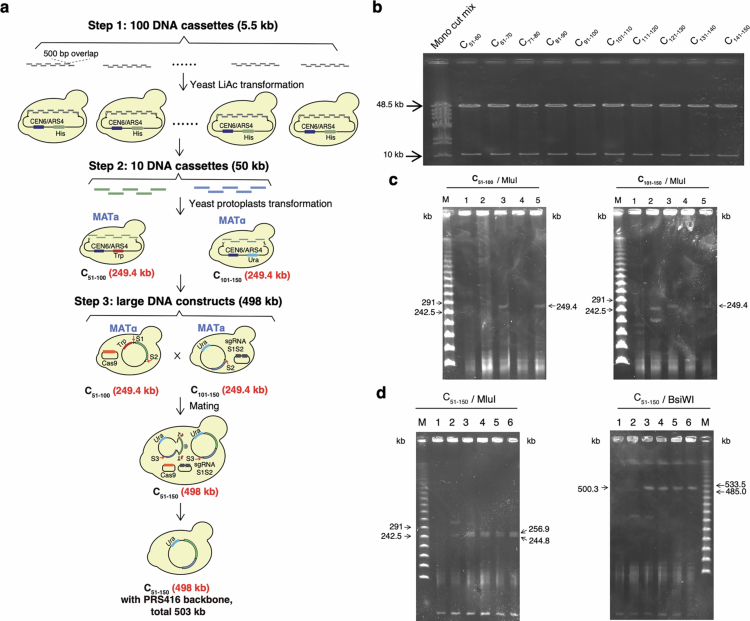
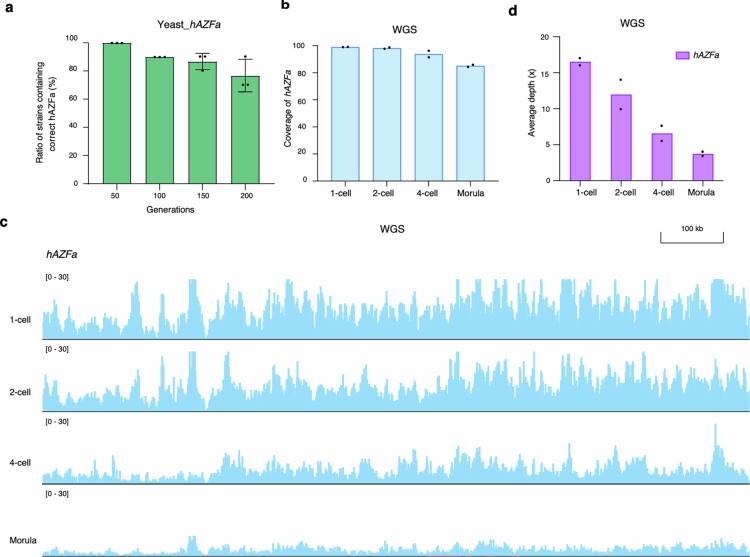
Epigenetic modifications on natural chromosomes are inherited and maintained in a default state, making it challenging to remove intrinsic marks to study the fundamental principles of their establishment and further influence on transcriptional regulation. In this study, we developed SynNICE, a method for assembling and delivering intact, naive, synthetic megabase (Mb)-scale human DNA into early mouse embryos, to study de novo epigenetic regulation. By assembling and delivering a 1.14-Mb human AZFa (hAZFa) locus, we observed the spontaneous incorporation of murine histones and the establishment of DNA methylation at the one-cell stage. Notably, DNA methylation from scratch strongly enriches at repeat sequences without H3K9me3 reinforcement. Furthermore, the transcription of hAZFa initiated at the four-cell stage is regulated by newly established DNA methylation. This method provides a unique platform for exploring de novo epigenomic regulation mechanisms in higher animals.


Conflict of interest statement

Competing interests: Y.Y., Y.L., J.Z. and Z.L. are co-investors on three patents related to SynNICE. L.Y. is co-founder and CEO of Qihan Biotech. The other authors declare no competing interests.

Figures

Fig. 1
Fig. 1. Schematic of the SynNICE method.
The method uses the combinatorial assembly strategy for assembling highly repetitive Mb-scale human DNA in yeast, followed by the NICE technique to isolate yeast nuclei with intact chromosomes.
Fig. 2
Fig. 2. Chemical synthesis and assembly of hAZFa in yeast.
a, The AZFa locus and UCSC database gene annotations are indicated. The hAZFa was designed to split into four large fragments—SynA, SynG, SynB and SynC—with two HERV15 block deletions. b, The vertical blue lines indicate the position of repetitive elements, including STRs, LTRs, LINEs and SINEs. c, Circos plot showing the assembly of hAZFa. Twelve 28-bp watermark sequences were inserted into the intron region of hAZFa. WM(n), watermark(n). d, The recombination-based combinatorial assembly strategy for Mb-scale synthetic human DNA with highly repetitive sequences. e, Restriction digestion analysis of hAZFa followed by PFGE. Yeast_hAZFa: S. cerevisiae VL6-48 containing hAZFa; Yeast_Control: S. cerevisiae VL6-48 harboring pRS416 as a control. Left, AscI enzyme digestion, with VL6-48 genome as a marker. Right, BsiWI enzyme digestion, with λ PFG ladder as a marker. n = 3 biological replicates. f, Growth assay of Yeast_hAZFa compared to Yeast_Control. g, Transcriptome analysis of Yeast_hAZFa compared to Yeast_Control. A two-sided adjusted P value (q value) threshold of 0.001 (Wald test with Benjamini–Hochberg correction) and a |log2(FC)| > 1.0 were used. h, The length of isoforms on hAZFa compared to yeast endogenous genome. i, Proteomic analysis of Yeast_hAZFa compared to Yeast_Control. Differentially expressed genes were identified using a two-sided P value threshold of 0.001 (Welch’s t-test) with FC > 1.2 or FC < 0.83. j, Genome-wide Hi-C contact map of the Yeast_hAZFa chromosome at a 10-kb resolution (left). The Hi-C interaction heatmap of hAZFa is magnified on the right. FC, fold change; LINE, long interspersed nuclear element; LTR, long terminal repeat; SINE, short interspersed nuclear element; STR, short terminal repeat; PFG, pulsed-field gel.
Fig. 3
Fig. 3. Developing NICE for intact Mb-scale synthetic DNA isolation while preserving chromosome structure.
a, Graphic depiction of yeast nuclei isolation with intact synthetic Mb-scale DNA, maintaining chromosome structure. b, PFGE analysis of the isolated yeast nuclei by NICE. Left, PFGE analysis of endogenous chromosomes. In Lane 1, nuclei were isolated according to the previous protocol; Lane 2 was optimized by adding DNase inhibitor; Lane 3 was optimized by adding spermine and spermidine; and Lane 4 was treated by adding both DNase inhibitor and spermine and spermidine. Analysis of hAZFa in isolated nuclei was performed by PFGE with AscI enzyme digestion, using VL6-48 genome as a marker (n = 3 biological replicates). c, Southern blot following PFGE analysis showing the integrity of full-sized hAZFa in isolated nuclei prepared by NICE, compared to in Yeast_hAZFa (n = 4 biological replicates). d, Staining for the isolated nucleus. DAPI staining for DNA and DiIC12(3) staining for yeast nuclear envelope. An overlay of the two signals (merge) is also shown. One representative image from three independent experiments is shown. Scale bars, 1 µm. e, The average signals of ATAC–seq enrichment around the central peak of hAZFa in isolated nuclei and yeast. Control: S. cerevisiae VL6-48 harboring pRS416. f, The average signals of H3K4me3 ChIP–seq enrichment around the peak center of hAZFa in isolated nuclei and yeast. g, Genome-wide Hi-C contact map of chromosomes in isolated nuclei at a 10-kb resolution (left). Zoom-in of the Hi-C interaction heatmap of hAZFa in isolated nuclei (right).
Fig. 4
Fig. 4. Chromatin remodeling of hAZFa in mouse early embryos.
a, Graphic illustration of hAZFa remodeling in mouse early embryos. b, Staining for the isolated yeast nucleus after injection into mouse MII oocytes with immediate fixation. Yeast nuclei membrane stained with DiIC12(3) (red) and DNA stained with DAPI (blue). The dashed circle represents the location of murine chromosome DNA. Scale bars, 20 µm. A magnified view shows the yeast nucleus in the oocyte cytoplasm. Scale bars, 1 µm. Quantification of three replicate experiments of yeast nuclei injected into mouse MII oocytes. Sample sizes are as follows: n = 11, 11 and 11. c, Live images of murine histones H3.3 (green) and H2B (red) incorporated into the yeast nucleus at 6 hours after injection. Scale bars, 20 µm. A magnified view shows the yeast nucleus in the cytoplasm. Scale bars, 1 µm. Quantification of three replicate experiments of murine histone incorporation. Sample sizes are as follows: n = 16, 21 and 11. d, Still images of timelapse imaging of H3.3–GFP in mouse MII oocytes. Timepoints represent hours after injection of yeast nuclei. Yeast nuclei with H3.3–GFP incorporation are indicated by yellow dashed circles. h, hours; TSS, transcription start site.
Fig. 5
Fig. 5. De novo DNA methylation in mouse one-cell embryos.
a, DAPI (blue), 5mC (green) and 5hmC (red) are co-staining in mouse embryos (8 hours after injection). Scale bars, 20 µm. A magnified view shows the yeast nucleus in the cytoplasm. Scale bars, 1 µm. Quantification of 5mc and 5hmc staining (n = 10). b, The genome browser view shows DNA methylation of hAZFa in mouse one-cell embryos (three biological replicates) compared to AZFa in human sperm and zygote. c, Numbers of CpG coverage sites and methylated sites of hAZFa in mouse one-cell embryos. d, The distribution of methylated sites in different transposable elements. e, The distribution of repeat sequences by filtering the methylation level of hAZFa in mouse one-cell early embryos (n = 3). Error bars, mean ± s.d. f, Bar charts showing the distribution of methylated sites in different genomic regions (n = 3). Error bars, mean ± s.d. g, Sequence feature of a 244-kb data-carrying BAC (up) and Integrative Genomics Viewer snapshot showing DNA methylation (two biological replicates) in mouse one-cell embryos (bottom). h, hours; LINE, long interspersed nuclear element; LTR, long terminal repeat; SINE, short interspersed nuclear element; UTR, untranslated region.
Fig. 6
Fig. 6. Transcriptional regulation of hAZFa in mouse early embryos.
a, Genome browser view showing RNA-seq signals of hAZFa genes in mouse early embryos compared to those of AZFa in human early embryos and homologous genes in wild-type mouse early embryos. b, Bar chart showing the DNA methylation of hAZFa (three biological replicates for one-cell and two-cell, and two biological replicates for four-cell). c, Genome browser view showing RNA-seq signals of whole hAZFa regions with or without 5-azadC (two-cell) and DMOG (four-cell and 12-hour delay) treatments. h, hours; TET, ten-eleven translocation.
Extended Data Fig. 1
Extended Data Fig. 1. Whole-genome sequencing of two AZFa microdeletion patients.
The genome browser view shows that both patients had ~798 kb deletions in the AZFa region.
Extended Data Fig. 2
Extended Data Fig. 2. Analysis of repeat sequence features of hAZFa compared with S. cerevisiae and E. coli genomes.
a, The percentage of each repeat class on hAZFa, S. cerevisiae, and E. coli. b, Total repetitive sequence content in hAZFa, S. cerevisiae and E. coli. c, Quantitation of repetitive element classes in hAZFa.
Extended Data Fig. 3
Extended Data Fig. 3. Assembly and characterization of hAZFa.
a, Restriction digestion analysis of SynA, SynB, SynG, and SynC followed by PFGE. Left, NruI enzyme digestion of SynG and λ PFG ladder as a marker. Right, SalI enzyme digestion of SynB, MluI enzyme digestion of SynA, SynC, and λ PFG ladder as a marker. n = 3 biological replicates. b, Restriction digestion analysis of SynAG and SynBC followed by PFGE. Left, MluI enzyme digestion of 599 kb SynAG and λ PFG ladder as a marker. Right, MluI enzyme digestion of 544 kb SynBC and λ PFG ladder as a marker. n = 3 biological replicates. c, Left, the sequencing coverage track for the full length of hAZFa was determined by using next-generation sequencing (NGS). The average depth of coverage was approximately 400×. Right, compared with the designed hAZFa locus, Yeast_hAZFa had 41 SNPs, 20 Indels, one intra-chromosomal translocation (ITX) of 115 bp, and no large structural variants (SVs).
Extended Data Fig. 4
Extended Data Fig. 4. Multi-omic characterization of hAZFa in S. cerevisiae.
a, Genome browser view showing expression of hAZFa have transcripts in yeast. b, Proteomic enrichment analysis of Yeast_hAZFa compared with Yeast_Control, with circle sizes representing protein number and color intensity indicating significance level. c, Total RNA yields from Yeast_hAZFa were similar to those from Yeast_Control. n = 3 biological replicates. d, Whole-protein extracts of Yeast_Control and Yeast_hAZFa were run on a 12% SDS-Bis-Tris acrylamide gel and stained with Coomassie blue, using NEB #P7712 as the protein marker. n = 3 biological replicates. e, 3D structure model shows interactions of hAZFa and endogenous chromosomes in yeast. f, Z-score difference contact heatmap shows a comparison of chromosome interactions of Yeast_hAZFa and Yeast_Control. Bin length, 10 kb; red and blue show increased and decreased chromatin interactions, respectively. g, Comparison of the endogenous yeast centromere relative interaction frequency between Yeast_hAZFa and Yeast_control. Data are presented as the mean ± SE. Two-tailed t-tests were used to evaluate differences between groups. (***) P < 0.001.
Extended Data Fig. 5
Extended Data Fig. 5. hAZFa in isolated yeast nuclei.
a, BsiWI enzyme digestion analysis of hAZFa in isolated nuclei followed by PFGE. n = 3 biological replicates. b, Southern blot to detect the integrity of hAZFa in isolated nuclei. Left, the original PFGE images of Fig. 3c. Middle, two independent southern blot experiments with four times NICE. Right, the ratio of full-sized hAZFa in isolated nuclei by NICE, compared with in Yeast_hAZFa calculated from southern blot out of PFGE (n = 4). c, Pulsed-field gel electrophoresis confirmed that the chromosomal DNA within the nuclei remained intact after 193 days of frozen storage at –80 °C. n = 3 biological replicates. d, Average FPKM of ATAC-seq peaks of each chromosome (up) and raw peaks on hAZFa (bottom), including hAZFa in Yeast_Control, Yeast_hAZFa, and isolated Yeast nuclei_hAZFa. e, Representative fluorescence images of ATAC-see (green) in isolated nuclei. Right, Violin plot of signal intensity of isolated nuclei. Sample sizes are as follows: Yeast nuclei_ hAZFa, n = 100. f, Average FPKM of H3K4me3 ChIP-seq peaks for each chromosome, including hAZFa in Yeast_Control, Yeast_hAZFa, and isolated Yeast nuclei_hAZFa. g, Representative fluorescence images depicting H3K4me3 in yeast and isolated nuclei. Right, violin plot of signal intensity of yeast and isolated nuclei. Sample sizes are as follows: Yeast_hAZFa, n = 100 and Yeast nuclei_hAZFa, n = 100.
Extended Data Fig. 6
Extended Data Fig. 6. 3D structures of Yeast nuclei_hAZFa compared with Yeast_ hAZFa.
a, 3D formation shows interactions of hAZFa and endogenous chromosomes in isolated nuclei. b, Z-score difference contact heatmap shows a comparison of chromosome interactions of Yeast nuclei_hAZFa and Yeast_hAZFa. Bin length, 10-kb; red and blue show increased and decreased chromatin interactions, respectively. c, Comparison of the centromere relative interaction frequency between isolated yeast nuclei and Yeast_hAZFa. Data are presented as the mean ± s.e. Two-tailed t-tests were used to evaluate differences between groups. (***) P < 0.001.
Extended Data Fig. 7
Extended Data Fig. 7. H3K9me3 signals of hAZFa, and DNA methylation of hAZFa and data-carrying BAC in mouse early embryos.
a, Genome browser view showing that de novo H3K9me3 of hAZFa in mouse 2-cell embryos compared with AZFa in human 4-cell and 8-cell embryos. b, The random snapshot from UCSC Genome Browser showing the H3K9me3 profile of our injected mouse early two-cell embryos performed by CUT&Tag, in comparison to the published H3K9me3 Chip-seq data from wild-type mouse early 2-cell embryos. c, The DNA methylation levels of hAZFa and yeast genome in mouse one-cell embryos compared with those in yeast. d, The DNA methylation level of data-carrying BAC in E. coli and in mouse one-cell embryos.
Extended Data Fig. 8
Extended Data Fig. 8. Transcriptional regulation of 76-kb BAC and hAZFa.
a, Genome browser view showing RNA-seq signals of the DDX3Y genes on hAZFa in mouse four-cell and morula embryos. b, Left, construction and microinjection of 76-kb BAC containing full-length TTTY15 and DDX3Y genes with flanking 5-kb regions. Right, RNA-seq of TTTY15 and DDX3Y genes on BAC in one-cell and early two-cell mouse embryos. c, Scatter plot showing gene expression fold-change upon adding 5-azadC, DMOG, and DMOG with 12 h postponing (2 biological replicates). FC, fold-change. Red lines, local regression fitting.
Extended Data Fig. 9
Extended Data Fig. 9. De novo assembly of the 498-kb human AZFc region using SynNICE.
a, 498 kb human AZFc region schematic. b, Restriction digestion analysis of ten 50-kb DNA fragments followed by PFGE. NotI digestion and λ DNA-Mono Cut Mix (NEB, N3019S) as a marker. n = 3 biological replicates. c, Restriction digestion analysis of 249.4 kb DNA fragments C51-100 and C101-150 followed by PFGE. MluI digestion and λ PFG ladder (NEB, N0341S) as a marker. n = 2 biological replicates. d, Restriction digestion analysis of 498 kb DNA fragment C51-150 followed by PFGE. MluI digestion (left) and BsiWI digestion (right), λ PFG ladder as a marker. n = 2 biological replicates.
Extended Data Fig. 10
Extended Data Fig. 10. Stability analysis of hAZFa in yeast and in mouse early embryos.
a, The ratio of strains containing the correct hAZFa constructs for 50, 100, 150, and 200 passages verified by PFGE. n = 3 biological replicates. Error bars, mean ± SD. b and c, The WGS coverage and IGV snapshot of hAZFa in mouse one-cell, two-cell, four-cell, and morula embryos. n = 2 biological replicates. d, The average depth of hAZFa in mouse one-cell, two-cell, four-cell, and morula embryos (average depth of each sample: ranging from 39.367 to 39.753). n = 2 biological replicates.

Similar articles

References

    1. Cello, J., Paul, A. V. & Wimmer, E. Chemical synthesis of poliovirus cDNA: generation of infectious virus in the absence of natural template. Science297, 1016–1018 (2002). - PubMed
    1. Gibson, D. G. et al. Creation of a bacterial cell controlled by a chemically synthesized genome. Science329, 52–56 (2010). - PubMed
    1. Fredens, J. et al. Total synthesis of Escherichia coli with a recoded genome. Nature569, 514–518 (2019). - PMC - PubMed
    1. Richardson, S. M. et al. Design of a synthetic yeast genome. Science355, 1040–1044 (2017). - PubMed
    1. Wu, Y. et al. Bug mapping and fitness testing of chemically synthesized chromosome X. Science355, eaaf4706 (2017). - PMC - PubMed

LinkOut - more resources