. 2025 Aug;17(8):2115-2136.
doi: 10.1038/s44321-025-00267-7. Epub 2025 Jul 10.

SFX-01 is therapeutic against myeloproliferative disorders caused by activating mutations in Shp2

Affiliations

SFX-01 is therapeutic against myeloproliferative disorders caused by activating mutations in Shp2

Hyun-Ju Cho et al. EMBO Mol Med. 2025 Aug.

Abstract

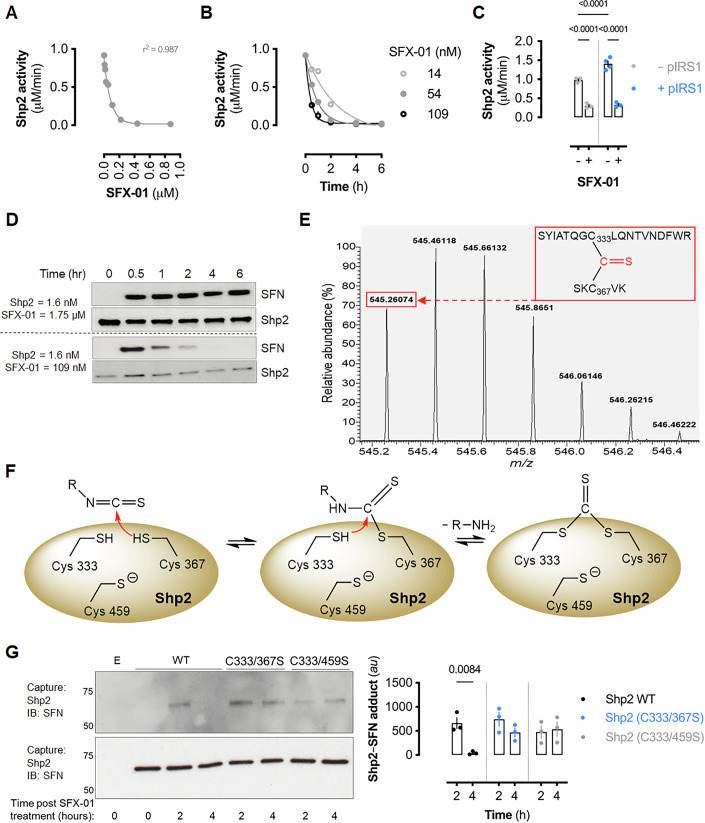
Activating mutations of Src homology-2 domain-containing protein tyrosine phosphatase-2 (Shp2) cause multiple childhood conditions for which there is an unmet therapeutic need, including juvenile myelomonocytic leukemia (JMML) and Noonan syndrome. SFX-01, an α-cyclodextrin-stabilized sulforaphane complex currently in clinical development, covalently adducts cysteine residues. Using unbiased proteomics, its protein targets were identified, including Shp2. SFX-01 induced an inhibitory dithiolethione modification at the Shp2 active site cysteine. Importantly, in a transgenic mouse model of human Noonan syndrome with hyperactive D61G Shp2, SFX-01 concomitantly normalized their phosphatase activity and myeloid cell count. Furthermore, SFX-01 also attenuated JMML human patient-derived hematopoietic stem cell proliferation that was linked to STAT1 signaling and decreased cyclin D1 expression, resulting in cell-cycle arrest. We conclude that SFX-01 is an activating mutant Shp2 inhibitor and may offer beneficial effects in patients with JMML or Noonan syndrome.

Keywords: Myeloproliferative Disorders; Noonan Syndrome; SFX-01; Shp2; Sulforaphane.


Conflict of interest statement

Disclosure and competing interests statement. The authors declare no competing interests. PE acknowledges he was an unpaid advisor to Theracryf plc.

Figures

Figure 1
Figure 1. Detection and identification of sulforaphane-modified proteins.
(A, B) Immunoblot and immunofluorescence analysis showing multiple proteins in HEK 293 cells modified in a concentration-dependent manner by SFN upon treatment with R-, S- or R, S-isomers. (C) Immunoblot analysis showing multiple proteins modified by SFN in widespread tissues 3-h after oral gavage of WT mice with SFN or SFX-01. (D) A silver-stained polyacrylamide gel showing immunoprecipitation of SFN-adducted proteins from the cardiac tissue of WT mice using the anti-SFN antibody following oral gavage of the electrophile. (E) Volcano plot showing cardiac proteins in the upper right quadrant that were significantly and reproducibly modified by SFN in mice (n = 4 biological replicates). Source data are available online for this figure.
Figure 2
Figure 2. Sulforaphane adducts Shp2 to induce an inhibitory dithiolethione modification in vitro.
(A) Recombinant human Shp2 activity after 30-min incubation with SFX-01. Data represent mean activity ( ± SEM; n = 3 biological replicates) and were fitted to a one-phase exponential decay curve (gray line; r2 = 0.987). (B) Shp2 activity after incubation with SFX-01 for the indicated times and concentrations. Data shown are mean activity ( ± SEM; n = 3 biological replicates). (C) Shp2 activity after 30-minute incubation with or without bisphosphorylated IRS1 and SFX-01. Bar represents mean activity (± SEM; n = 4 biological replicates) and P values calculated by two-way ANOVA with Sîdak post hoc test. (D) Representative immunoblots showing SFN-modification of recombinant Shp2 (1.6 nM) following incubation with 1.75 or 0.109 µM SFX-01 for 30 min. (E) Precursor isotopic envelop spectrum of 0.1 µM recombinant human Shp2 protein incubated with equimolar SFN for 6 h at 37 °C corresponding to a dithiolethione modification adducted between Cys333 and Cys367. (F) Schematic representing the proposed mechanism of Shp2-dithiolethione formation by SFN. The isothiocyanate group reacts with a cysteine residue to form a dithiocarbamate intermediate, which further reacts with a second cysteine residue to yield the dithiolethione modification. (G) Immunoblot of immunoprecipitated WT or active site mutant Shp2 and SFN-modification from HEK cells treated with SFX-01. “E” represents non-transfected cells, and 0 h represents untreated cells. The graph represents densitometric analysis of Shp2-SFN adduct formation in WT or mutant Shp2 exposed to SFX-01 for 2 or 4 h. Bars represent mean values (± SEM; n = 3 biological replicates) and P values calculated by two-way ANOVA with Sîdak post hoc test. Source data are available online for this figure.
Figure 3
Figure 3. SFX-01 inhibits wild-type and mutant Shp2 phosphatase activity in vivo.
Shp2 phosphatase activity in (A) cardiac tissue (n = 8 mice) and (B) spleen of WT (n = 4 mice) or Ptpn11D61G(−/+) mice (n = 5 mice) that received SFX-01 in the drinking water for 10 days. (A, B) Bars represent mean activity ( ± SEM) and P values calculated by two-way ANOVA with Sîdak post hoc test. (C) Representative immunoblots showing the input and immunoprecipitated Shp2 protein and SFN-labeled Shp2 from cardiac tissue isolated from mice with or without oral SFX-01 administration as in (A). (D) Representative immunoblot of Shp2 immunoprecipitated from cardiac tissue of WT mice following treatment with SFX-01 for 4 days after incubation with biotin-iodoacetamide. (E) Representative far-western immunoblot of Shp2 immunoprecipitated from cardiac tissue of WT mice following treatment with SFX-01 for 4 days. The immunoblot was then exposed to biotin-phenylarsenic acid (PAA). Source data are available online for this figure.
Figure 4
Figure 4. SFX-01 is therapeutic against myeloid disease in Noonan syndrome mice.
(A) Changes in leukocyte cell populations in blood isolated from individual WT or Ptpn11D61G(−/+) mice before and after 10 weeks of SFX-01 in drinking water. P values were calculated by paired t tests. For WT mice: n = 14 before and after vehicle treatment, n = 14 before SFX-01 treatment, and n = 15 after SFX-01 treatment. For Ptpn11D61G(−/+) mice: n = 14 before vehicle treatment, n = 16 after vehicle treatment, n = 11 before SFX-01 treatment, and n = 14 after SFX-01 treatment. (B) Blood leukocyte cell population after 10 weeks SFX-01 treatment. (left) Bars represent mean leukocyte population ( ± SEM) and P values calculated by two-way ANOVA with Sîdak post hoc test. For WT mice: n = 14 vehicle treatment, and n = 15 SFX-01 treatment. For Ptpn11D61G(−/+) mice: n = 16 vehicle treatment, and n = 14 SFX-01 treatment. (right) Representative microphotographs of Wright-Giemsa-stained blood isolated from mice after 10 weeks SFX-01 treatment or controls. Scale bars show 200 µm. (C) Violin plots of blood myeloid-derived (CD11b+/Ly6G+ and CD11b+/Ly6C+) cell populations from WT or Ptpn11D61G(−/+) mice after 10 weeks of SFX-01 in drinking water. Horizontal lines represent quartiles and P values calculated by two-way ANOVA with Sîdak post hoc test. For WT mice: n = 13 vehicle or SFX-01 treatment. For Ptpn11D61G(−/+) mice: n = 9 vehicle treatment, and n = 13 SFX-01 treatment. (D) Changes in spleen size from individual WT or Ptpn11D61G(−/+) mice before and after 10 weeks of SFX-01 in drinking water. P values were calculated by paired t tests. For WT mice: n = 14 before and after vehicle treatment (P = 0.0102), n = 14 before and after SFX-01 treatment (P = 0.0890). For Ptpn11D61G(−/+) mice: n = 13 before and after vehicle treatment (P = 0.0253), n = 15 before and after SFX-01 treatment (P = 0.1694) for each group. (E) Mean changes in spleen size in WT or Ptpn11D61G(−/+) mice over 10 weeks of SFX-01 treatment compared to before treatment. Bars represent mean spleen size ( ± SEM) and P values calculated by two-way ANOVA with Sîdak post hoc test. For WT mice: n = 14 vehicle or SFX-01 treatment. For Ptpn11D61G(−/+) mice: n = 13 vehicle treatment, and n = 15 SFX-01 treatment. (F) Violin plots of spleen myeloid-derived (CD11b+/Ly6G+ and CD11b+/Ly6C+) cell populations from WT or Ptpn11D61G(−/+) mice after 10 weeks of SFX-01 in drinking water. Horizontal lines represent quartiles and P values calculated by two-way ANOVA with Sîdak post hoc test. For WT mice: n = 14 vehicle treatment, and n = 15 SFX-01 treatment (P = 0.6138). For Ptpn11D61G(−/+) mice: n = 16 vehicle treatment, and n = 12 SFX-01 treatment (P = 0.0251). Source data are available online for this figure.
Figure 5
Figure 5. SFX-01 induces cell cycle arrest via hyperactive STAT1 signaling.
(A) Representative immunoblot of relative STAT1 phosphorylation and cyclin D1 expression in leukocytes isolated from WT or Ptpn11D61G(−/+) mice after 10-week SFX-01 treatment. Graphs represent densitometric analyses of relative STAT1 (Ser 727) phosphorylation and cyclin D1 expression. Bars represent mean expression level ( ± SEM) and P values calculated by two-way ANOVA with Sîdak post hoc test. n = 5 mice for STAT1 (Ser 727) phosphorylation and n = 3 mice biological replicates for cyclin D1 expression. (B) Representative immunoblots of relative STAT1 phosphorylation and cyclin D1 expression in a Shp2-activating mutant expressing human GDM-1 cell line treated with SFX-01 or vehicle. Graph bars represent mean expression levels ( ± SEM; n = 4 biological replicates) and P values calculated by unpaired t test. (C) Cell cycle analysis of GDM-1 cells cultured with SFX-01. Bars represent mean percentage ( ± SEM), and significance compared to controls was calculated by one-way ANOVA with Dunnett’s test. n = 4 for vehicle or 250 µM SFX-01 treatment, n = 3 for 1, 5, 25, or 100 µM SFX-01 treatment, biological replicates. (D) Colony-forming ability of GDM-1 cells treated with SFX-01. Bars represent mean normalized values (± SEM), and because of the low sample size and not assuming a normal Gaussian distribution, significance was calculated using a Kruskal–Wallis test with an uncorrected Dunn’s test for comparison to the control group. n = 2 for vehicle treatment, n = 3 for 0.1 µM SFX-01 treatment (P = 0.3957), n = 3 for 1 µM SFX-01 treatment (P = 0.2167), n = 5 for 10 µM SFX-01 (P = 0.0245) and n = 3 for 100 µM SFX-01 (P = 0.0018) treatment, biological replicates. (E) Cell cycle analysis and (F) colony-forming ability of control (CB) or JMML patient-derived HSCs cultured with or without SFX-01. Clonogenicity of HSC was normalized to control cells, and bars represent mean ( ± SEM) and P values calculated by two-way ANOVA with Sîdak post hoc test. For (E): CB: n = 3 for vehicle, 5, or 25 µM SFX-01 treatment, and n = 2 for 100 µM SFX-01 treatment. JMML: n = 7 for vehicle or 5 µM SFX-01 treatment, and n = 8 for 25 or 100 µM SFX-01 treatment, biological replicates. For (F): CB: n = 14 for vehicle treatment, n = 4 for 10 µM SFX-01 treatment, n = 17 for 50 µM SFX-01 treatment, and n = 19 for 100 µM SFX-01 treatment. JMML: n = 6 for vehicle or 10 µM SFX-01 treatment, n = 11 for 50 µM SFX-01 treatment, and n = 12 for 100 µM SFX-01 treatment, biological replicates. (G) A heatmap displaying the significantly altered Shp2 substrates in CD11b+ myeloid bone marrow cells isolated from WT or Ptpn11D61G(−/+) mice, under conditions with or without SFX-01 treatment based on data from the phosphoproteomics analysis (n = 3 biological replicates). Source data are available online for this figure.
Figure EV1
Figure EV1. Combined treatment with SFX-01 and Shp2 did not accentuate their individual attenuation of proliferation.
CD11b+ bone marrow cells isolated from WT and Ptpn11D61G(−/+) mice treated with SFX-01, SHP099 or both together. SFX-01 or SHP099 attenuated cell proliferation and this was not accentuated when these interventions were combined. Data are presented as means ( ± SEM; n = 5–6) with P values calculated by two-way ANOVA with Tukey’s multiple comparison test. *P < 0.00001 versus untreated WT or #P < 0.00001 versus untreated Ptpn11D61G(−/+).

References

    1. Alcolea MP, Casado P, Rodríguez-Prados J-C, Vanhaesebroeck B, Cutillas PR (2012) Phosphoproteomic analysis of leukemia cells under basal and drug-treated conditions identifies markers of kinase pathway activation and mechanisms of resistance*. Mol Cell Proteom 11:453–466 - PMC - PubMed
    1. Alpha-Tocopherol BCCPSG (1994) The effect of vitamin E and beta carotene on the incidence of lung cancer and other cancers in male smokers. N Engl J Med 330:1029–1035 - PubMed
    1. Araki T, Mohi MG, Ismat FA, Bronson RT, Williams IR, Kutok JL, Yang W, Pao LI, Gilliland DG, Epstein JA et al (2004) Mouse model of Noonan syndrome reveals cell type- and gene dosage-dependent effects of Ptpn11 mutation. Nat Med 10:849–857 - PubMed
    1. Artoni A, Selicorni A, Passamonti SM, Lecchi A, Bucciarelli P, Cerutti M, Cianci P, Gianniello F, Martinelli I (2014) Hemostatic abnormalities in Noonan syndrome. Pediatrics 133:e1299–1304 - PubMed
    1. Bauman JE, Hsu CH, Centuori S, Guillen-Rodriguez J, Garland LL, Ho E, Padi M, Bageerathan V, Bengtson L, Wojtowicz M et al (2022) Randomized crossover trial evaluating detoxification of tobacco carcinogens by broccoli seed and sprout extract in current smokers. Cancers 14:2129 - PMC - PubMed

MeSH terms

Substances

LinkOut - more resources