How machine learning on real world clinical data improves adverse event recording for endoscopy
- PMID: 40640575
- PMCID: PMC12246240
- DOI: 10.1038/s41746-025-01826-5
How machine learning on real world clinical data improves adverse event recording for endoscopy
Abstract
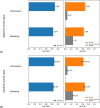
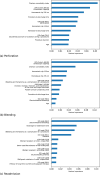
Endoscopic interventions are essential for diagnosing and treating gastrointestinal conditions. Accurate and comprehensive documentation is crucial for enhancing patient safety and optimizing clinical outcomes; however, adverse events remain underreported. This study evaluates a machine learning-based approach for systematically detecting endoscopic adverse events from real-world clinical metadata, including structured hospital data such as ICD-codes and procedure timings. Using a random forest classifier detecting adverse events perforation, bleeding, and readmission, we analysed 2490 inpatient cases, achieving significant improvements over baseline prediction accuracy. The model achieved AUC-ROC/AUC-PR values of 0.9/0.69 for perforation, 0.84/0.64 for bleeding, and 0.96/0.9 for readmissions. Results highlight the importance of multiple metadata features for robust predictions. This semi-automated method offers a privacy-preserving tool for identifying documentation discrepancies and enhancing quality control. By integrating metadata analysis, this approach supports better clinical decision-making, quality improvement initiatives, and resource allocation while reducing the risk of missed adverse events in endoscopy.
© 2025. The Author(s).
Conflict of interest statement
Competing interests: S.B. declares consulting services for Olympus. I.W. received honoraria from AstraZeneca. J.K. declares consulting services for Bioptimus, France; Panakeia, UK; AstraZeneca, UK; and MultiplexDx, Slovakia. Furthermore, he holds shares in StratifAI, Germany, Synagen, Germany, Ignition Lab, Germany; has received an institutional research grant by G.S.K.; and has received honoraria by AstraZeneca, Bayer, Daiichi Sankyo, Eisai, Janssen, Merck, MSD, BMS, Roche, Pfizer, and Fresenius. All other authors declare no competing interests.
Figures


Similar articles
-
Proposal for Using AI to Assess Clinical Data Integrity and Generate Metadata: Algorithm Development and Validation.JMIR Med Inform. 2025 Jun 30;13:e60204. doi: 10.2196/60204. JMIR Med Inform. 2025. PMID: 40587839 Free PMC article.
-
Comparison of Two Modern Survival Prediction Tools, SORG-MLA and METSSS, in Patients With Symptomatic Long-bone Metastases Who Underwent Local Treatment With Surgery Followed by Radiotherapy and With Radiotherapy Alone.Clin Orthop Relat Res. 2024 Dec 1;482(12):2193-2208. doi: 10.1097/CORR.0000000000003185. Epub 2024 Jul 23. Clin Orthop Relat Res. 2024. PMID: 39051924
-
Eliciting adverse effects data from participants in clinical trials.Cochrane Database Syst Rev. 2018 Jan 16;1(1):MR000039. doi: 10.1002/14651858.MR000039.pub2. Cochrane Database Syst Rev. 2018. PMID: 29372930 Free PMC article.
-
Shared decision-making interventions for people with mental health conditions.Cochrane Database Syst Rev. 2022 Nov 11;11(11):CD007297. doi: 10.1002/14651858.CD007297.pub3. Cochrane Database Syst Rev. 2022. PMID: 36367232 Free PMC article.
-
Signs and symptoms to determine if a patient presenting in primary care or hospital outpatient settings has COVID-19.Cochrane Database Syst Rev. 2022 May 20;5(5):CD013665. doi: 10.1002/14651858.CD013665.pub3. Cochrane Database Syst Rev. 2022. PMID: 35593186 Free PMC article.
References
-
- Kavic, S. M. & Basson, M. D. Complications of endoscopy. Am. J. Surg.181, 319–332 (2001). - PubMed
-
- Mergener, K. Defining and measuring endoscopic complications: more questions than answers. Gastrointest. Endosc. Clin. N. Am.17, 1–9 (2007). - PubMed
-
- Adler, A. et al. Data quality of the German screening colonoscopy registry. Endoscopy45, 813–818 (2013). - PubMed
-
- Harerimana, G., Kim, J. W., Yoo, H. & Jang, B. Deep learning for electronic health records analytics. IEEE Access7, 101245–101259 (2019).
LinkOut - more resources
Full Text Sources
Research Materials

