

The prognostic value of immunoscore in the early-onset colorectal cancer
- PMID: 40640712
- PMCID: PMC12247202
- DOI: 10.1186/s12876-025-04055-y
The prognostic value of immunoscore in the early-onset colorectal cancer
Abstract
Background: The purpose of this study was to explore the prognostic value of Immunoscore in patients with early-onset colorectal cancer.
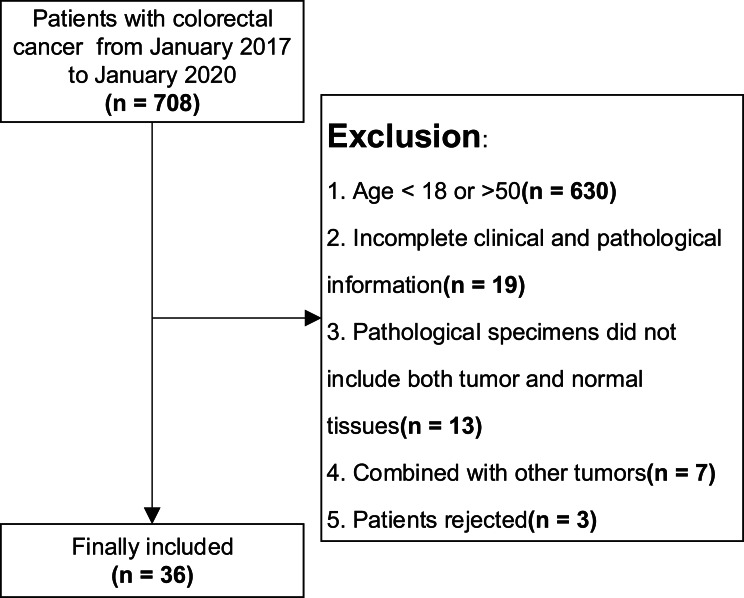
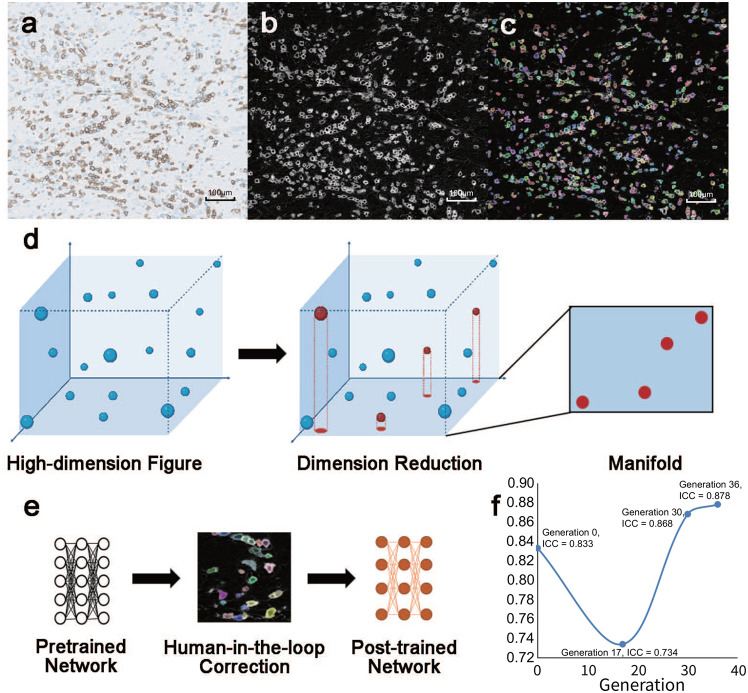
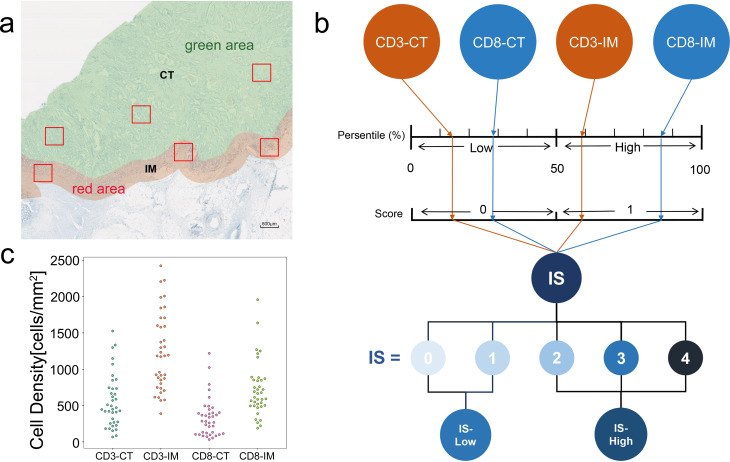
Methods: We retrospectively analyzed 708 colorectal adenocarcinoma patients (2017-2020), ultimately including 36 early-onset colorectal cancer cases after exclusions. CD3+/CD8 + lymphocytes were quantified using immunohistochemistry and a self-trained neural network model from Cellpose 2.0. Immunoscore was calculated based on T cell densities in tumor cores and invasive margins, stratified as high or low. Prognostic associations were assessed via Kaplan-Meier analysis, Cox regression, and restricted cubic spline models. Results of Cox regression was validated by post-hoc analysis.
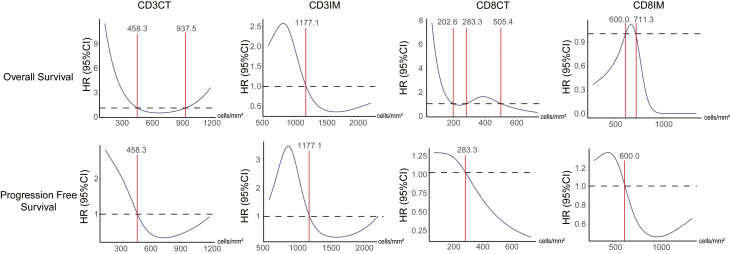
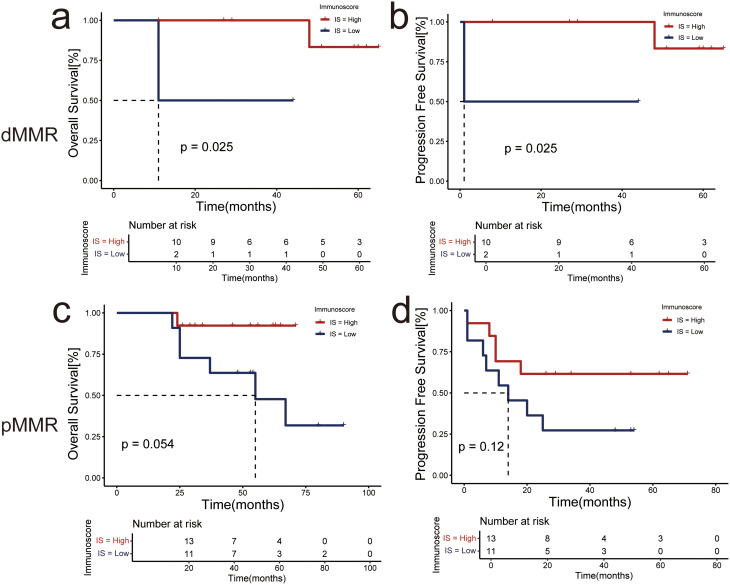
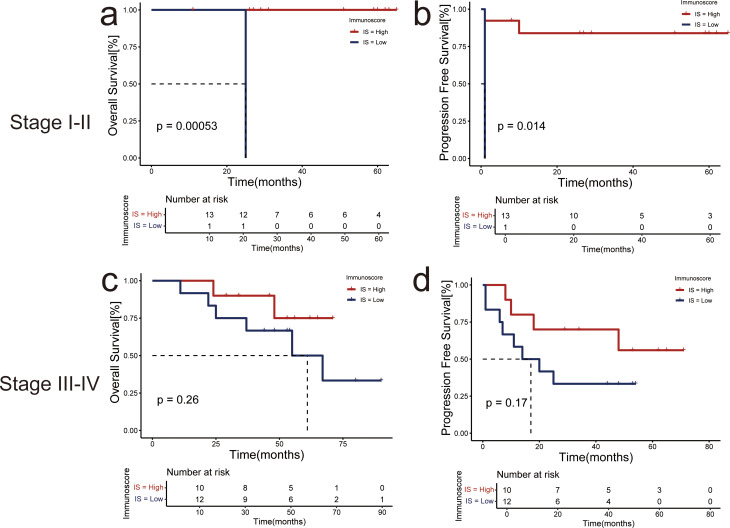
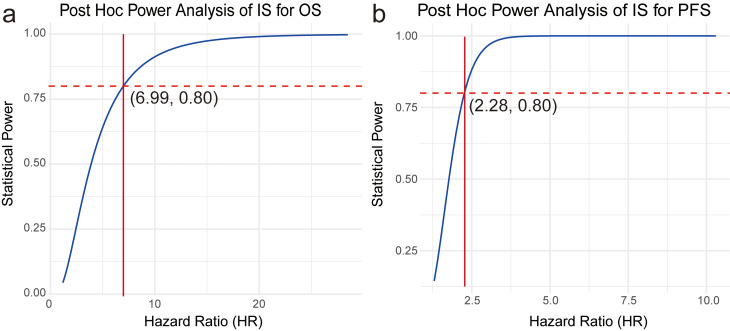
Results: Of all early-onset colorectal cancer patients, 23(63.9%) patients were graded as Immunoscore-high, 13(36.1%) were graded as Immunoscore-low. The self trained model achieved high consistency with manual counting. High Immunoscore correlated with earlier clinical stages (stage I/II: P = 0.011), reduced metastasis risk (N0, P = 0.042; M0, P = 0.009), and lower mortality (P = 0.009). Univariate Cox regression analysis identified Immunoscore as a possible predictor for overall survival (Hazard Ratio = 5.82, P = 0.030) and progression free survival (Hazard Ratio = 3.68, P = 0.014). The Post-hoc power analysis showed the type II error probability (β) of univariate Cox analysis for overall survival with a hazard ratio of 5.82 was 0.282 (28.2%), while for progression free survival with a hazard ratio of 3.68, β was 0.006 (0.6%). Restricted cubic spline showed that the influence of CD3+/CD8 + cells in different region on prognosis was not simply linear. Although Immunoscore didn't remain statistically significant as an independent predictor of OS (Hazard Ratio = 4.76; P = 0.138) and PFS (Hazard Ratio = 1.83; P = 0.360) in multivariate Cox regression analysis, stratified Kapan-Meier curves by MMR status and clinical stage showed well separation.
Conclusion: Immunoscore can serve as a possible indicator in predicting prognosis of patients with early-onset colorectal cancer, but still need large sample research validation.
Keywords: Cellpose 2.0; Early onset colorectal cancer; Immunoscore; Machine learning.
© 2025. The Author(s).
Conflict of interest statement
Declarations. Ethics approval and consent to participate: This study was approved by the Ethics Committee of Peking University People’s Hospital. This study conforms to the provisions of the Declaration of Helsinki. Informed consent was obtained from all subjects. Consent for publication: Not applicable. Competing interests: The authors declare no competing interests.
Figures

Similar articles
-
Impact of residual disease as a prognostic factor for survival in women with advanced epithelial ovarian cancer after primary surgery.Cochrane Database Syst Rev. 2022 Sep 26;9(9):CD015048. doi: 10.1002/14651858.CD015048.pub2. Cochrane Database Syst Rev. 2022. PMID: 36161421 Free PMC article.
-
Cost-effectiveness of using prognostic information to select women with breast cancer for adjuvant systemic therapy.Health Technol Assess. 2006 Sep;10(34):iii-iv, ix-xi, 1-204. doi: 10.3310/hta10340. Health Technol Assess. 2006. PMID: 16959170
-
Comparison of Two Modern Survival Prediction Tools, SORG-MLA and METSSS, in Patients With Symptomatic Long-bone Metastases Who Underwent Local Treatment With Surgery Followed by Radiotherapy and With Radiotherapy Alone.Clin Orthop Relat Res. 2024 Dec 1;482(12):2193-2208. doi: 10.1097/CORR.0000000000003185. Epub 2024 Jul 23. Clin Orthop Relat Res. 2024. PMID: 39051924
-
Competing risk and random survival forest models for predicting survival in post-resection elderly stage I-III colorectal cancer patients.Sci Rep. 2025 Jul 7;15(1):24269. doi: 10.1038/s41598-025-05824-1. Sci Rep. 2025. PMID: 40624131 Free PMC article.
-
Development and validation of a Log odds of negative lymph nodes/T stage ratio-based prognostic model for gastric cancer.Front Oncol. 2025 Jun 3;15:1554270. doi: 10.3389/fonc.2025.1554270. eCollection 2025. Front Oncol. 2025. PMID: 40530015 Free PMC article.
References
-
- Siegel RL, Torre LA, Soerjomataram I, et al. Global patterns and trends in colorectal cancer incidence in young adults. Gut. 2019;68:2179–85. 10.1136/gutjnl-2019-319511. - PubMed
-
- Patel SG, Karlitz JJ, Yen T, Lieu CH, Boland CR. The rising tide of early-onset colorectal cancer: a comprehensive review of epidemiology, clinical features, biology, risk factors, prevention, and early detection. Lancet Gastroenterol Hepatol. 2022;7(3):262–74. 10.1016/S2468-1253(21)00426-X. - PubMed
-
- Nagtegaal ID, Quirke P, Schmoll HJ. Has the new TNM classification for colorectal cancer improved care? Nat Rev Clin Oncol. 2011;9(2):119–23. 10.1038/nrclinonc.2011.157. Published 2011 Oct 18. - PubMed
MeSH terms
Grants and funding
- 2159000118/Horizontal Research Project of Beijing Science and Technology Planning Project
- 2159000118/Horizontal Research Project of Beijing Science and Technology Planning Project
- 2159000118/Horizontal Research Project of Beijing Science and Technology Planning Project
- 2159000118/Horizontal Research Project of Beijing Science and Technology Planning Project
LinkOut - more resources
Full Text Sources
Medical
Research Materials
