. 2025 Jul 10;24(1):272.
doi: 10.1186/s12933-025-02801-w.

Acid sphingomyelinase promotes diabetic cardiomyopathy via disruption of mitochondrial calcium homeostasis

Affiliations

Acid sphingomyelinase promotes diabetic cardiomyopathy via disruption of mitochondrial calcium homeostasis

Yu Wei et al. Cardiovasc Diabetol. .

Abstract

Background: Impaired Ca2+ handling is involved in diabetic cardiomyopathy (DCM) progression. The activation of acid sphingomyelinase (ASMase) stimulated cardiomyocytes apoptosis and caused DCM. Here, we aimed to investigate whether ASMase regulates mitochondrial Ca2+ homeostasis by acting on mitochondrial calcium uptake 1 (MICU1) and mitochondria-associated endoplasmic reticulum membranes (MAMs) formation to induce apoptosis during DCM.

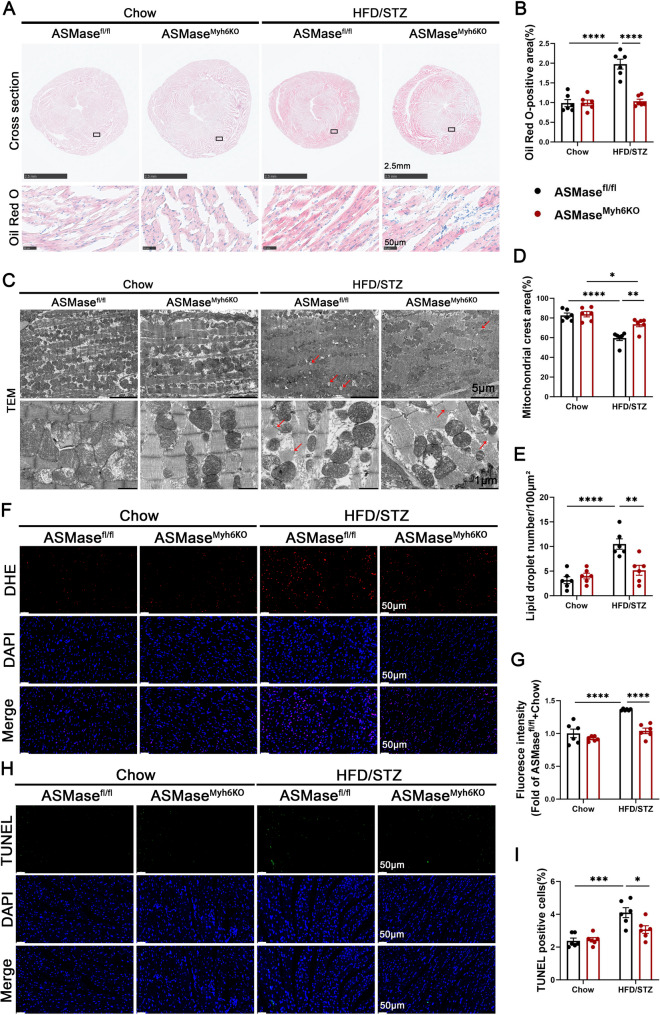
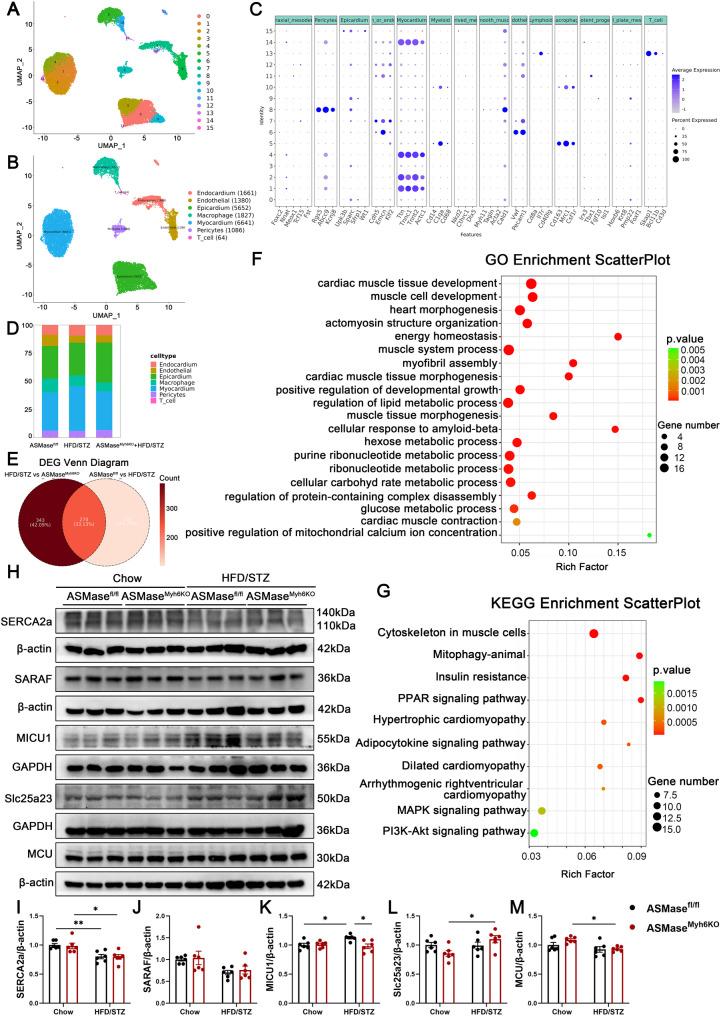
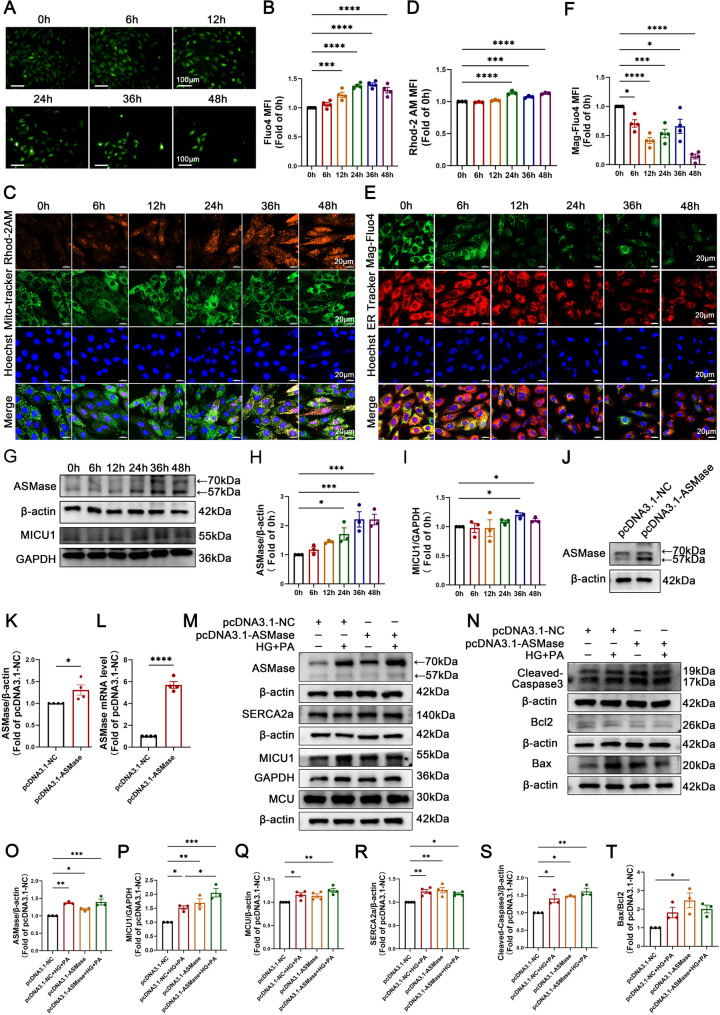
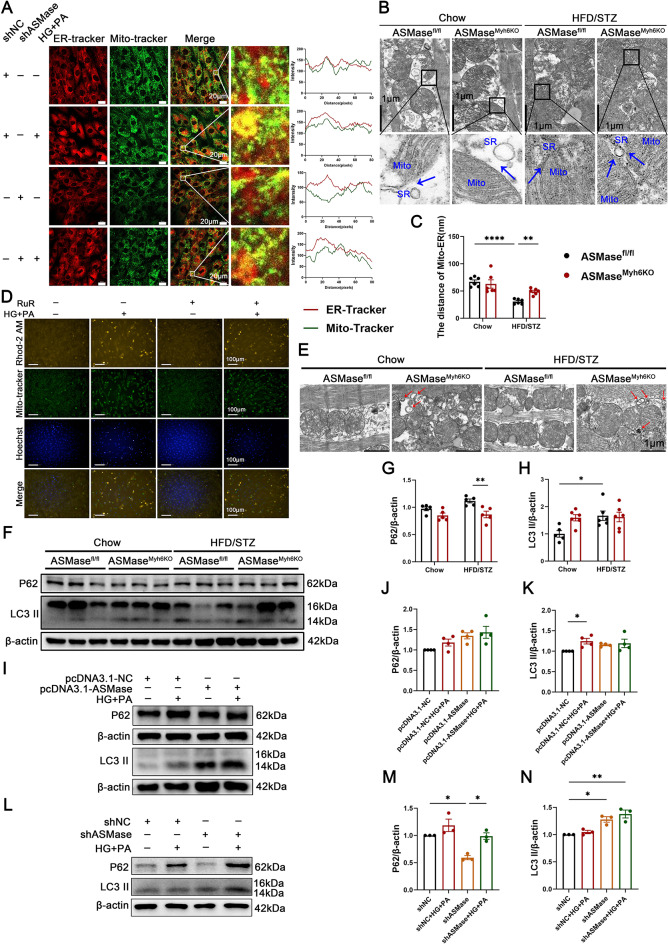
Methods and results: We established a type 2 diabetes model by combining high-fat diet (HFD) with streptozotocin (STZ) injection in wild-type and cardiomyocyte-specific ASMase deletion (ASMaseMyh6KO) mice. ASMase deletion restored HFD/STZ-induced cardiac dysfunction, remodeling, myocardial lipid accumulation and apoptosis. Single cell sequencing and Gene ontology (GO) enrichment analysis pointed to "cardiac muscle contraction" and "positive regulation of mitochondrial calcium ion concentration", which were confirmed by high glucose (HG, 30 mM) and palmitic acid (PA, 200 μM) induced mitochondrial Ca2+ overload in H9c2 cell lines at time dependence, accompanied by the upregulation of ASMase and MICU1 protein expressions. The similar effects were noted in ASMase overexpressed cardiomyocytes. Interestingly, endoplasmic reticulum (ER) Ca2+ level was decreased at the corresponding time, suggesting that increased mitochondrial Ca2+ level may be derived from ER. Notably, enhanced MAMs formation was found in HG + PA treated H9c2 cells, accompanied by blocked autophagy, similar results were obtained in ASMase overexpressing cells or HFD/STZ hearts. Loss of ASMase prevented HFD/STZ or HG + PA incubation induced cardiac hypertrophy, mitochondrialCa2+ overload, ROS production, autophagy blockage and MICU1 upregulation.

Conclusions: HFD/STZ-induced ASMase upregulation enhances MAMs formation, promoting mitochondrial Ca2+ overload through MICU1 activation, leading to ROS generation, autophagy blockage and apoptosis in DCM. Therefore, targeting ASMase-MICU1 pathway emerges as a potential therapeutic approach for managing DCM.

Keywords: ASMase; Diabetic cardiomyopathy; MICU1; Mitochondrial calcium homeostasis.


Conflict of interest statement

Declarations. Ethics approval and consent to participate: All animal experiments were performed according to the Guidelines of Animal Experiments from Committee of Medical Ethics at the National Health Department of China and were approved by Central South University (CSU-2020-0027). Consent for publication: Not applicable. Competing interests: The authors declare no competing interests.

Figures

Fig. 1
Fig. 1
Cardiomyocyte-specific deletion of ASMase alleviated cardiac dysfunction and remodeling in mice with HFD/STZ-induced DCM. Cardiomyocyte-specific deletion of ASMase in a diabetic model was fed with HFD for 20 weeks. A, B Representative Western blot images and quantitative analysis of ASMase expression in cardiac tissues of mice across four groups. C, D Representative immunofluorescence images and quantitative analysis of ASMase expression in cardiac tissues of mice across four groups, scale bar: 50 μm. E The body weight of mice was documented weekly. FH Representative M-mode echocardiographic images and the corresponding quantitative analysis of cardiac function including ejection fraction (EF %) and fractional shortening (FS %). IL Representative images and quantitative analysis of H&E, WGA, Masson and Sirius Red in the hearts of mice from four groups, scale bar: 2.5 mm and 50 μm. Data were presented as mean ± SEM. n = 6. *P < 0.05, **P < 0.01, ***P < 0.001, ****P < 0.0001
Fig. 2
Fig. 2
ASMase deletion attenuated myocardial lipid accumulation and mitochondrial injury. A, B Representative images and quantitative analysis of Oil Red O staining in the hearts of mice across four groups, scale bar: 50 μm. C Lipid droplets and the morphology, size, and number of cardiac mitochondrial were observed using transmission electron microscopy (TEM), with scale bars of 5 μm and 1 μm. D The area of the mitochondrial crest was determined. E The number of lipid droplet per 100 μm2. F, G Representative images and quantitative analysis of DHE staining in hearts of mice across four groups, scale bar: 50 μm. H Representative images of TUNEL staining in hearts of mice across four groups, scale bar: 50 μm. I Quantitative analysis of TUNEL-positive cells in cardiac tissues of mice. Data were presented as mean ± SEM. n = 6. *P < 0.05, **P < 0.01, ***P < 0.001, ****P < 0.0001
Fig. 3
Fig. 3
Calcium homeostasis dysfunction involved in HFD/STZ induced DCM. A UMAP plot of 16 cell clusters representing predominant cell types. B UMAP plot of 7 types of cells annotation outcomes and their respective quantities. C Bubble plot depicting the results of 16 cell cluster annotations. D Percentage bar chart depicting the percentage of cell types. E DEG Venn Diagram between ASMasefl/fl versus HFD/STZ and HFD/STZ verus ASMaseMyh6KO + HFD/STZ. F, G GO enrichment scatter plot and KEGG enrichment scatter plot in 270 DEGs. H–M Representative Western blot images and quantitative analysis of SERCA2a, SARAF, MICU1, SLC25A23 and MCU expressions in cardiac tissues from four groups of mice. Data were presented as mean ± SEM. n = 6. *P < 0.05, **P < 0.01, ***P < 0.001, ****P < 0.0001
Fig. 4
Fig. 4
ASMase disrupted mitochondrial calcium homeostasis via MICU1 upregulation. A, B Representative fluorescence images and quantitative analysis of Fluo4 AM labeling observe the temporal variations of cytoplasmic calcium, scale bar:  100 μm. C, D Representative fluorescence images and quantitative analysis of Mito-Tracker, Rhod-2AM and Hoechst staining to visualize the temporal variations of mitochondrial calcium, scale bar: 20 μm. E, F Representative fluorescence images and quantitative analysis of ER-Tracker, Mag-Fluo4 AM and Hoechst staining to evaluate the temporal variations of endoplasmic reticulum calcium, scale bar: 20 μm. GI Representative images and quantitative analysis of the temporal variations of ASMase and MICU1 expressions in H9c2 cells cultured with high glucose and palmitic acid for 48 h. JL Representative images and quantitative analysis of ASMase expression in H9c2 cells transfected with either pcDNA3.1-NC or pcDNA3.1-ASMase. MT Representative Western blot images and quantitative analysis of ASMase, SERCA2a, MICU1, MCU, cleaved-Caspase3, Bcl2 and Bax expressions in H9c2 cells transfected with either pcDNA3.1-NC or pcDNA3.1-ASMase. Data were presented as mean ± SEM. n = 3 *P < 0.05, **P < 0.01, ***P < 0.001, ****P < 0.0001
Fig. 5
Fig. 5
ASMase deletion rescued mitochondrial calcium overload by downregulation of MICU1. AC Representative images and quantitative analysis of ASMase expression in H9c2 cells transfected with either shRNA negative control (shNC) or shRNA targeting ASMase (shASMase). D, E Representative Western blot images and quantitative analysis of ASMase expression in H9c2 cells transfected with either shNC or shASMase. F, H Representative images and quantitative analysis of Rhod-2 AM, Mito-Tracker and Hoechst staining, scale bar: 20 μm. G, I Representative images and quantitative analysis of Mag-Fluo4, ER-Tracker and Hoechst staining, scale bar: 20 μm. J, K Representative Western blot images and quantitative analysis of MICU1 expression in H9c2 cells transfected with either shNC or shASMase. LQ Representative images and quantitative analysis of DCFH-DA, phalloidin and TUNEL staining for the assessment of reactive oxygen species (ROS), hypertrophy and apoptosis, scale bar: 100 μm. Data were presented as mean ± SEM. n = 3. *P < 0.05, **P < 0.01, ***P < 0.001, ****P < 0.0001
Fig. 6
Fig. 6
ASMase deficiency reduced MAMs formation and restored autophagy. A Correlation between mitochondria and the endoplasmic reticulum was observed using confocal imaging, the area analyzed is indicated by the white box in the microscopic image, the details show the colocalization of red and green channels, scale bar: 20 μm. B Distance between mitochondria and the sarcoplasmic reticulum was observed using TEM, the area analyzed is indicated by the black box in the microscopic image, the blue arrows show the the distance between mitochondria and sarcoplasmic reticulum, scale bar: 1 μm. C Quantitative analysis of the distance between mitochondria and sarcoplasmic reticulum. D Representative fluorescence images of Mito-Tracker, Rhod-2 AM and Hoechst staining in H9c2 cells cultured with or without ruthenium red (RuR), scale bar: 100 μm. E Representative TEM images of left ventricular specimens of different groups (the red arrows indicate autophagosomes), scale bar: 1 μm. FH Representative Western blot images and quantitative analysis of P62 and LC3 II expressions in cardiac tissues of mice across four groups. IK Representative images and quantitative analysis of P62 and LC3 II expressions in H9c2 cells transfected with either pcDNA3.1-NC or pcDNA3.1-ASMase. LN Representative Western blot images and quantitative analysis of P62 and LC3 II expressions in H9c2 cells transfected with either shNC or shASMase. Data were presented as mean ± SEM. n = 3 or 6. *P < 0.05, **P < 0.01, ***P < 0.001, ****P < 0.0001

References

    1. Yao Y, Yang B, Shi J. TiO(x)(OH)(4–2x) nanosheets with catalytic antioxidative activity alleviate oxidative injury in diabetic cardiomyopathy. J Am Chem Soc. 2025;147(4):3885–95. - PubMed
    1. Dillmann WH. Diabetic cardiomyopathy. Circ Res. 2019;124(8):1160–2. - PMC - PubMed
    1. Guo X, Wang L, Xuan J, et al. Fluoride induces spermatocyte apoptosis by IP3R1/MCU-mediated mitochondrial calcium overload through MAMs. J Hazard Mater. 2025;489: 137514. - PubMed
    1. Csordás G, Golenár T, Seifert EL, et al. MICU1 controls both the threshold and cooperative activation of the mitochondrial Ca2⁺ uniporter. Cell Metab. 2013;17(6):976–87. - PMC - PubMed
    1. Sancak Y, Markhard AL, Kitami T, et al. EMRE is an essential component of the mitochondrial calcium uniporter complex. Science. 2013;342(6164):1379–82. - PMC - PubMed

MeSH terms

Substances

LinkOut - more resources