. 2025 Jul 10;22(1):179.
doi: 10.1186/s12974-025-03505-4.

Gut microbiota-derived indoleacetic acid attenuates neuroinflammation and neurodegeneration in glaucoma through ahr/rage pathway

Affiliations

Gut microbiota-derived indoleacetic acid attenuates neuroinflammation and neurodegeneration in glaucoma through ahr/rage pathway

Ning Wang et al. J Neuroinflammation. .

Abstract

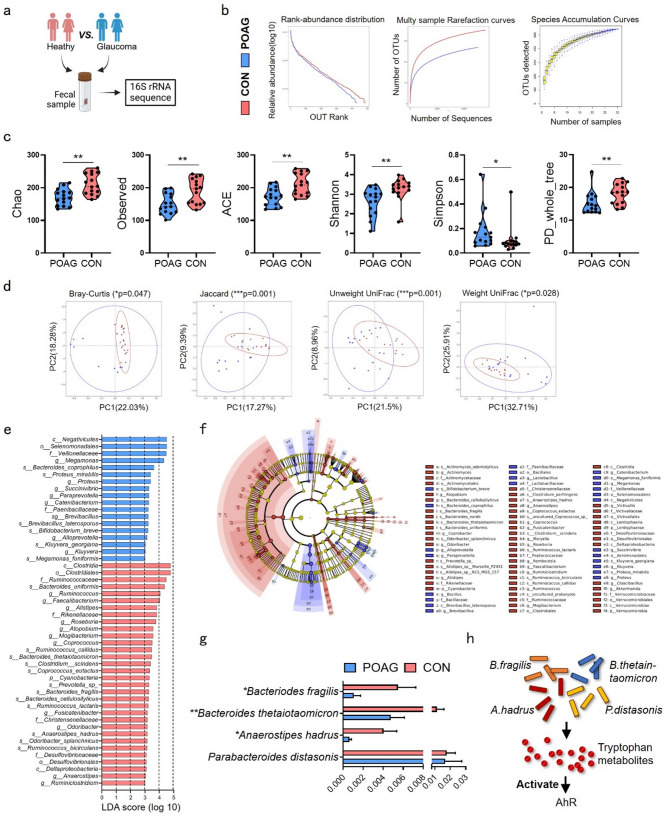
Background: Gut microbiota has emerged as a promising therapeutic target for neurodegenerative disorders through regulation of neuroinflammatory responses, while its role in optic nerve degeneration remains incompletely characterized. This study elucidates the neuroprotective role of gut microbiota derived tryptophan metabolites in glaucoma through gut-eye communication and inhibition of microglia-mediated neuroinflammation.

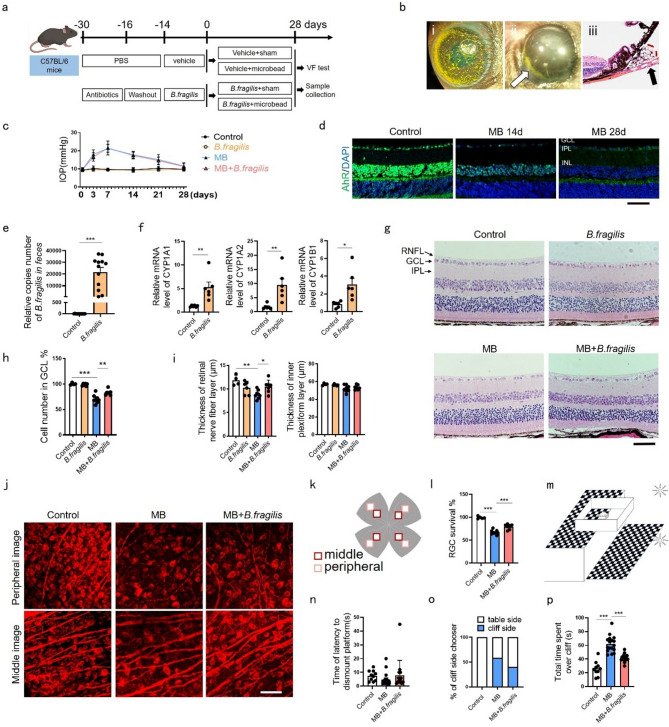
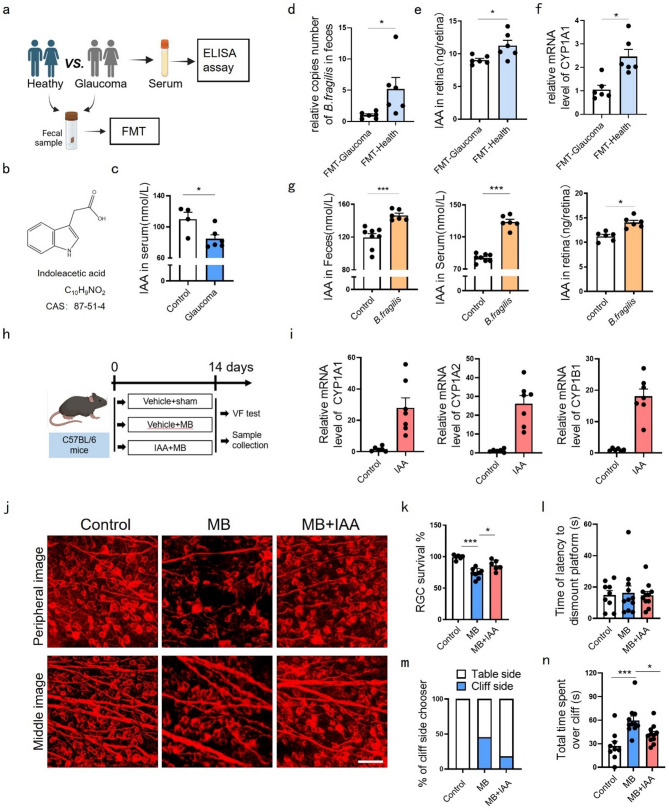
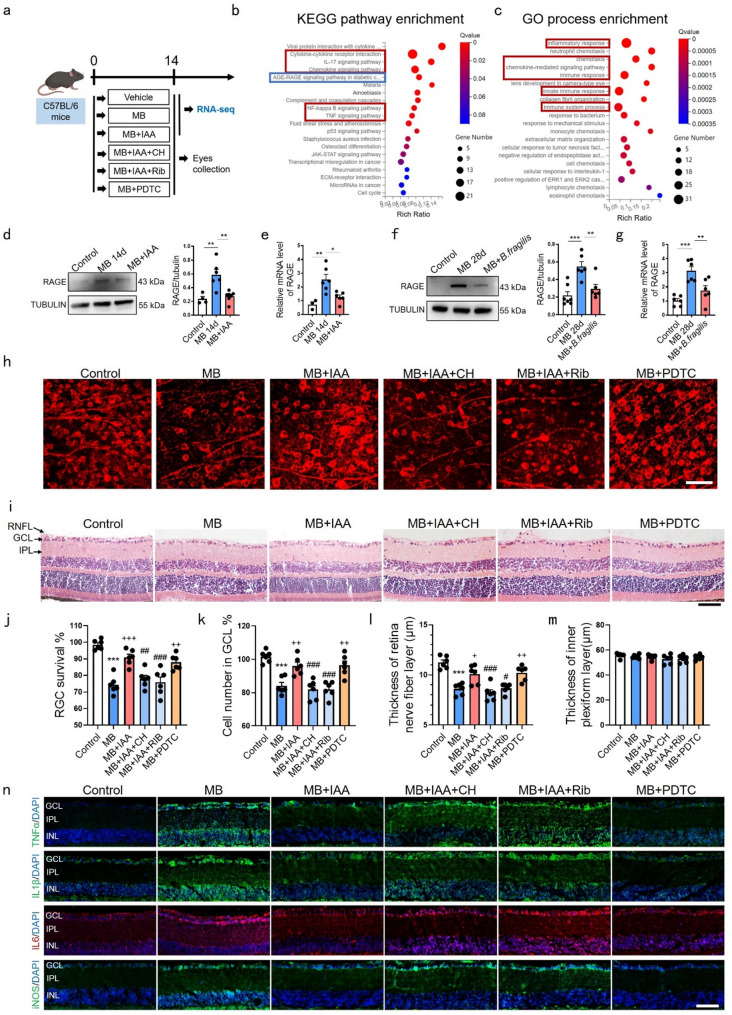
Methods: Gut microbiota profiling (16 S rRNA sequencing) and serum indoleacetic acid (IAA) quantification were performed in glaucoma patients versus controls. Microbiota-metabolite relationships were further validated through fecal microbiota transplantation (FMT). The neuroprotective and anti-neuroinflammatory effect of Bacteroides fragilis (B. fragilis) and IAA was assessed in both microbead-induced ocular hypertension mice model and in vitro BV-2 microglial cell inflammation model via immunofluorescence, qPCR, Western blot and mice behavioral assays. To explore the underlying mechanisms, retinal transcriptomics and microglia-neuron co-cultures were also employed.

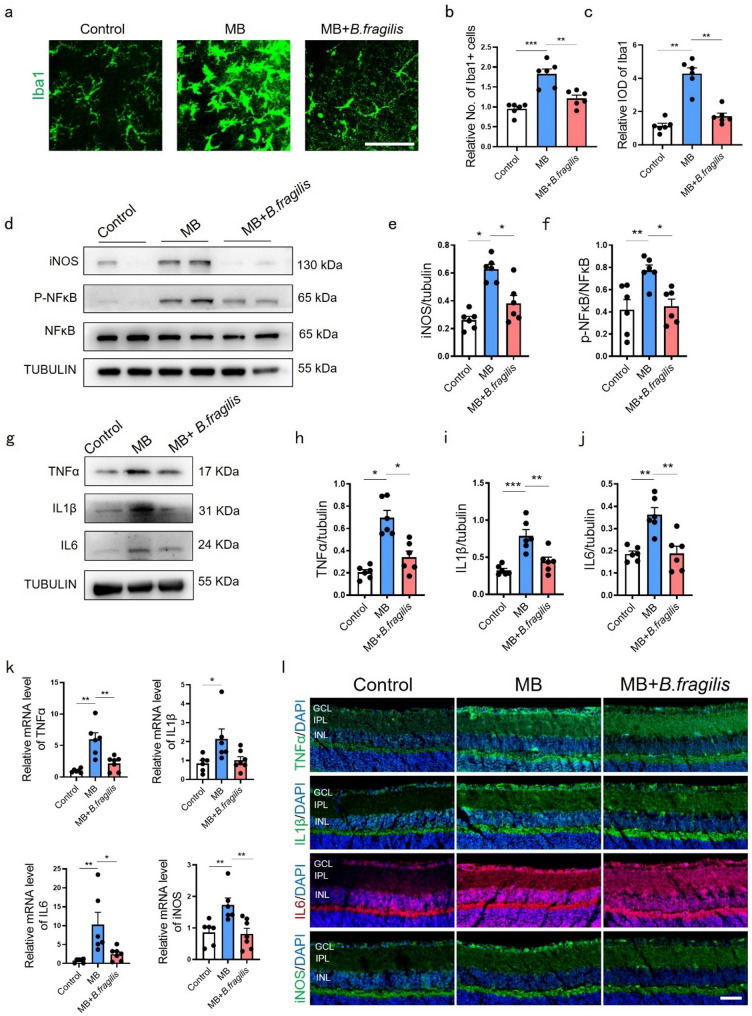
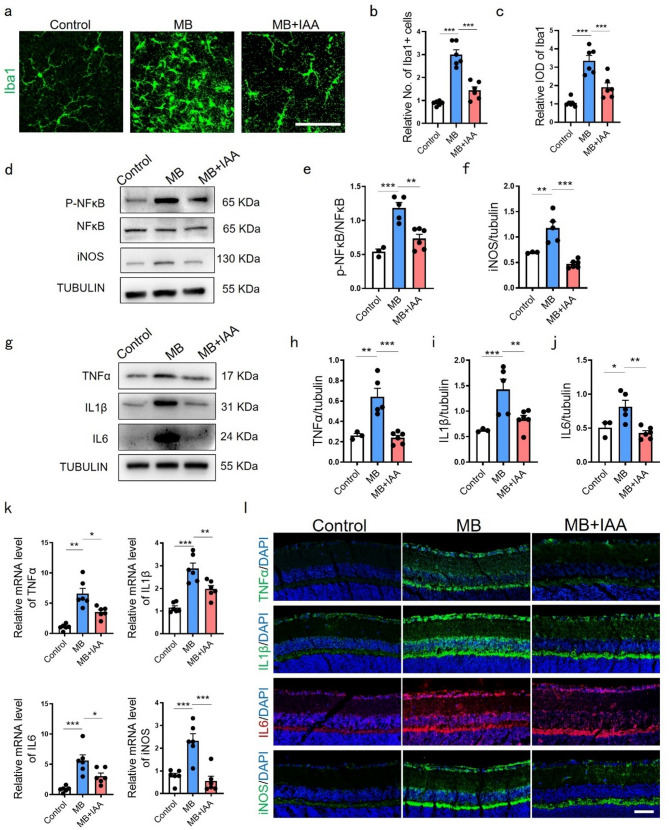
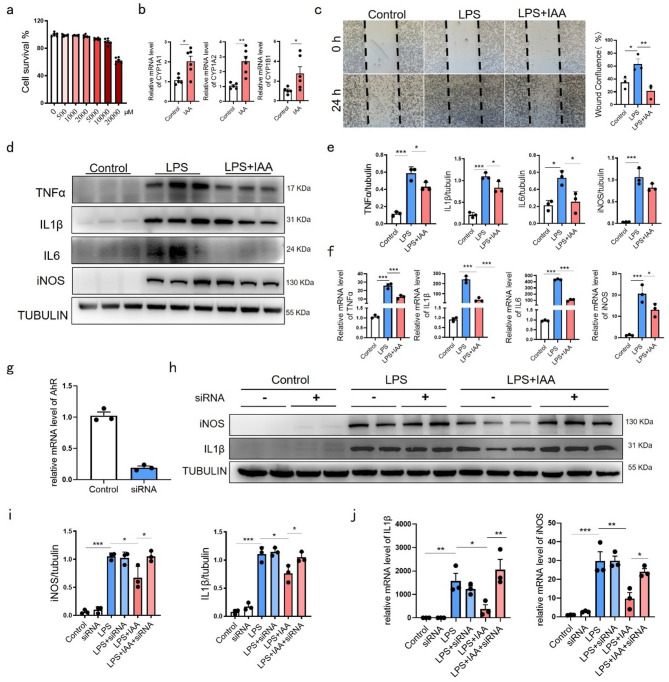
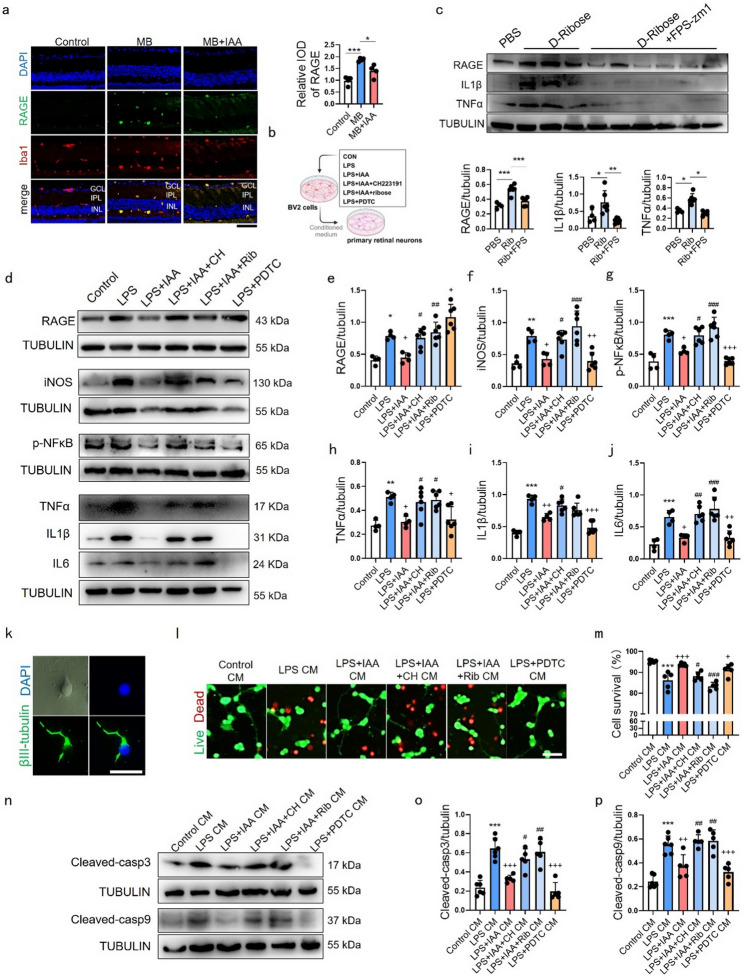
Result: Glaucoma patients exhibited gut dysbiosis characterized by depleted tryptophan-metabolizing bacteria (B. fragilis, Bacteroides thetaiotaomicron, Anaerostipes hadrus) and reduced serum IAA levels. Mice receiving FMT from glaucoma patients exhibited lower systemic IAA levels. In in vivo and in vitro models, B. fragilis or IAA restored AhR activation, suppressed inflammation by inhibiting microglial activation and the release of pro-inflammatory mediators throughout the retina, reduced retinal ganglion cells (RGCs) loss and preserved visual function. Mechanistically, IAA attenuated RAGE/NF-κB pathway activation via AhR-dependent signaling, conferring neuroprotection.

Conclusion: Our study proposes a novel AhR-mediated gut microbiota-eye axis in glaucoma pathogenesis and demonstrates that IAA serves as an effective neuroprotective strategy with clinical potential for managing RGCs neurodegeneration.

Keywords: AhR; Glaucoma; Gut microbiota-eye axis; Microglia; Neuroinflammation; Tryptophan metabolites.


Conflict of interest statement

Declarations. Ethics approval and consent to participate: This study was approved by the Committee of Animal Care of the Shanghai 9th People’s Hospital Affiliated to Shanghai Jiaotong University School of Medicine (Approval no. SH9H-2022-A16-2). All animal experiments were performed in accordance with the Association for Research in Vision and Ophthalmology’s Statement for Use of Animals. The protocol for human serum collection were approved by the institutional review board of Ninth People’s hospital affiliated with the Shanghai Jiao Tong University School of Medicine (No. SH9H-2021-T184-2) and informed consent was obtained from all subjects. Consent for publication: All consent included in this study are available upon request by contact with the corresponding author. Competing interests: The authors declare no competing interests.

Figures

Fig. 1
Fig. 1
Microbial atlas in POAG patients and healthy controls. (a) Fecal sample from heathy control and POAG patients were collected for 16 S rRNA sequence. (b) Rank abundance distribution, Multy sample rarefaction curves and Species accumulation curves. (c) Richness and evenness of gut microbiome were evaluated by Alpha-diversity indexes including Chao, Observed, ACE, Shannon, Simpson and PD whole tree. (d) Beta-diversity was showed by measuring Bray-Curtis, Jaccard, Unweight UniFrac and Weight UniFrac indexes. (e) LefSe was used to identify differences of bacterial taxa between the two groups. Taxa with LDA scores > 3 were showed under Kruskal-Wallis test. (f) The cladograms were constructed with LefSe analysis. (g) Comparations of four tryptophan-metabolizing bacteria between two groups were showed. (h) The diagram showed that four tryptophan-metabolizing bacteria activated AhR by producing tryptophan metabolites. POAG, POAG patients; CON, healthy control. Data represented the mean ± SEM, *P < 0.05, **P < 0.01. Alpha-diversity was showed under non-parametric Wilcox test, Beta-diversity were showed under MRPP
Fig. 2
Fig. 2
B. fragilis alleviated RGCs loss and retinal dysfunction in MB-induced ocular hypertension mice. (a) Schematic illustration of timeline and experimental design. (b) (i) mouse eye after injection of MB; (ii) MB deposition near the anterior chamber angle, photographed on the third day after injection; (iii) H&E-stained eye cross sections from day 28 after injection showing the accumulation of MB in the anterior chamber angle (arrows). (c) IOP changes with or without B. fragilis gavage administration after MB injection. Control or MB group, n = 17; B. fragilis or MB + B. fragilis group, n = 15. (d) Immunofluorescence staining showing gradually decreased expression of AhR (green) in mice retinal sections from control to 14 and 28 days after MB treatment (n = 4). Bar = 50 μm. (e) Quantitative PCR Analysis of B. fragilis 16 S gene copies in fecal DNA extracts after gavage administration of B. fragilis for 14 days. Control, n = 13; gavage group, n = 12. (f) Analysis of CYP1A1, CYP1A2, and CYP1B1 mRNA expression in the retina of mice with or without B. fragilis gavage administration for 14 days. (g) H&E-stained eye cross sections at day 28 after MB injection with or without B. fragilis gavage administration. Bar = 50 μm. (h, i) Quantitative analysis of cells number of GCL, thickness of RNFL and IPL in (g). Control, n = 4; B.fragilis, n = 6; MB, n = 8; MB + B. fragilis, n = 7. GCL, ganglion cell layer. (j) Representative confocal photomicrographs taken from the retinal flat mount of mice with βIII-tubulin (red) labeling RGCs at 28 days following MB injected. Bar = 30 μm. (k) The position of the field of view in (j). (l) Percentage of RGCs survival with or without B. fragilis gavage administration after MB injection. Control, n = 5; MB, n = 9; MB + B. fragilis, n = 7. (m) The diagram illustrating the setup of the visual cliff test. (n-p) Histograms showing time of latency to dismount platform of mice, number of mice with first foot on cliff side and total time spent over cliff with or without B. fragilis gavage administration after MB injection in visual cliff test. Control, n = 10; MB, n = 17; MB + B. fragilis, n = 15. Data are presented as mean ± SEM, *P < 0.05, **P < 0.01, ***P < 0.001
Fig. 3
Fig. 3
B. fragilis suppressed neuroinflammation caused by MB-induced ocular hypertension damage. (a) Immunofluorescence staining and relative expression of Iba1 (green) in retinal flat mounts of mice from control, MB and MB + B. fragilis groups. Bar = 50 μm. (b) Relative quantification of Iba1 + cells in retina at day 28 post MB injection with or without B. fragilis. n = 6. (c) Relative integral optical density (IOD) of Iba1 in retina at 28 days post MB injection with or without B. fragilis. n = 6. (d) Representative western blot showing the protein expression levels of iNOS, p-NFκB and NFκB in control, MB and MB + B. fragilis groups. (e-f) Quantification data of proteins in (d) were measured. iNOS was normalized to beta-tubulin, and p-NFκB was normalized to NFκB. n = 6. (g) Representative western blot showing the protein expression levels of TNFα, IL1β, IL6 in control, MB and MB + B. fragilis groups. (h-j) Quantification data of proteins in (g) were normalized to beta-tubulin. n = 6. (k) Relative mRNA expression of TNFα, IL1β, IL6 and iNOS in control, MB and MB + B. fragilis groups evaluated by quantitative real-time PCR. Control and MB groups, n = 6; MB + B. fragilis group, n = 7. (l) Representative immunofluorescence images showing localization and relative expression of TNFα, IL1β, IL6 and iNOS in the GCL, IPL and INL of mice retinal cross-sections. n = 4. Bar = 50 μm. Data are presented as mean ± SEM, *P < 0.05, **P < 0.01, ***P < 0.001
Fig. 4
Fig. 4
IAA ameliorated RGCs loss and retinal function impairment in MB-induced ocular hypertension mice. (a) Serum samples from control and POAG patients were collected for ELISA and FMT experiments. (b) The chemical formula for indoleacetic acid. (c) Histograms showed levels of IAA in serum of POAG patients and controls. POAG group, n = 6; control group, n = 4. (d) Quantitative PCR Analysis of B. fragilis 16 S gene copies in fecal DNA extracts after FMT for 7days, n = 6. (e) Histograms showed levels of IAA in retinas of mice after FMT for 7days, n = 6. (f) Quantitative PCR Analysis of CYP1A1 mRNA expression, n = 6. (g) Levels of IAA in mice feces, serum or retinas 14 days post B. fragilis gavage administration tested by ELISA. Control group, n = 8 for feces and serum, n = 6 for retinas; B. fragilis group, n = 6. (h) Schematic illustration of timeline and experimental design. (i) Quantitative analysis of CYP1A1, CYP1A2, and CYP1B1 mRNA expression in the retina of mice with or without IAA administration. Control group, n = 6; IAA group, n = 7. (j) Representative confocal photomicrographs of mice retinal flat mounts with βIII-tubulin (red) labeling RGCs at 14 days following MB injected. Bar = 30 μm. (k) Percentage of RGCs survival with or without IAA administration post MB injection. Control group, n = 6; MB group, n = 8; MB + IAA group, n = 6. (l) Histograms showed time of latency to dismount platform of mice, (m) number of mice with first foot on cliff side and (n) total time spent over cliff with or without IAA administration post MB injection in visual cliff test. Control group, n = 9; MB group, n = 11; MB + IAA group, n = 11. Data are presented as mean ± SEM, *P < 0.05, **P < 0.01, ***P < 0.001
Fig. 5
Fig. 5
IAA inhibited neuroinflammation caused by MB-induced ocular hypertension damage. (a) Immunofluorescence staining and relative expression of Iba1 (green) in retinal flat mounts of mice post MB with or without IAA. Bar = 50 μm. (b) Relative quantification of Iba1 + cells in retina at 14 days post MB injection with or without IAA. n = 6. (c) Relative IOD of Iba1 in retina at 14 days post MB injection with or without IAA. n = 6. (d) Representative western blot showing the protein expression levels of p-NFκB, NFκB and iNOS in control, MB and MB + IAA groups. (e-f) Quantitative protein levels in (d) were measured. iNOS was normalized to beta-tubulin, and p-NFκB was normalized to NFκB. Control group, n = 3; MB group, n = 5; MB + IAA group, n = 6. (g) Representative western blot showing the protein expression levels of TNFα, IL1β, IL6 in control, MB and MB + IAA groups. (h-j) Quantitative data of proteins in (g) were normalized to beta-tubulin. Control group, n = 3; MB group, n = 5; MB + IAA group, n = 6. (k) Relative mRNA expression of TNFα, IL1β, IL6 and iNOS in control, MB and MB + IAA groups evaluated by quantitative PCR. n = 6. (l) Representative immunofluorescence images showing localization and relative expression of TNFα, IL1β, IL6 and iNOS in the GCL, IPL and INL of mice retinal cross-sections. n = 5. Bar = 50 μm. Data are presented as mean ± SEM, *P < 0.05, **P < 0.01, ***P < 0.001
Fig. 6
Fig. 6
IAA relieved microglial inflammation by activating AhR. (a) The CCK8 assay was employed to assess the impact of varying concentrations of IAA on the viability of BV-2 cells. n = 6. (b) Analysis of CYP1A1, CYP1A2, and CYP1B1 mRNA expression of BV-2 cells with or without IAA administration. Control group, n = 5; IAA group, n = 6. (c) Histogram and photographs showing microglial wound confluence post scratch with or without IAA. n = 3. Bar = 200 μm. (d) Representative western blot showing the protein expression levels of TNFα, IL1β, IL6 and iNOS in control, LPS and LPS + IAA groups. (e) Quantitative data of proteins in (d) were normalized to beta-tubulin. n = 3. (f) Relative mRNA expression of TNFα, IL1β, IL6 and iNOS in control, LPS and LPS + IAA groups evaluated by quantitative PCR. n = 3. (g) AhR silencing efficiency > 80% reduction in AhR mRNA. n = 3. (h) Representative western blot showing the protein expression levels of iNOS and IL1β in control, siRNA AhR, LPS, LPS + siRNA AhR, LPS + IAA and LPS + IAA + siRNA AhR groups. (i) Quantitative data of proteins in (h) were normalized to beta-tubulin. n = 3. (j) Relative mRNA expression of iNOS and IL1β in control, siRNA AhR, LPS, LPS + siRNA AhR, LPS + IAA and LPS + IAA + siRNA AhR groups. Data are presented as mean ± SEM, *P < 0.05, **P < 0.01, ***P < 0.001
Fig. 7
Fig. 7
Effects of IAA on RGCs and inflammation depend on AhR activation and RAGE inhibition. (a) Schematic illustration of timeline and experimental design. (b) KEGG pathway enrichment and (c) GO process enrichment of the differences between MB and MB + IAA groups. (d) Representative western blot showing the protein expression levels of RAGE at 14 days post MB injection with or without IAA. Quantitative data of proteins were normalized to beta-tubulin. Control group, n = 4; MB group, n = 6; MB plus IAA group, n = 7. (e) Relative mRNA expression of RAGE in control, MB and MB + IAA groups. (f) Representative western blot showing the protein expression levels of RAGE at 28 days post MB injection with or without B. fragilis. Quantitative data of proteins were normalized to beta-tubulin. Control group, n = 7; MB group, n = 6; MB + IAA group, n = 6. (g) Relative mRNA expression of RAGE in control, MB and MB + B. fragilis groups. n = 6. (h) Representative confocal photomicrographs of mice retinal flat mounts with βIII-tubulin (red) labeling RGCs in control, MB, MB + IAA, MB + IAA + CH (CH223191, AhR inhibitor), MB + IAA + Rib (D-Ribose, RAGE agonist), MB + PDTC (NFκB antagonist) groups. Bar = 30 μm. (i) H&E-stained eye cross sections at day 14 post-MB in above mentioned 6 groups. Bar = 50 μm. (j) Percentage of RGCs survival in (h). n = 6. (k-m) Quantitative analysis of cells number of ganglion cell layer, thickness of RNFL and IPL in (i). n = 6. (n) Representative immunofluorescence images showing localization and relative expression of TNFα, IL1β, IL6 and iNOS in the GCL, IPL and INL of mice retinal cross-sections. n = 4. Bar = 50 μm. Data are presented as mean ± SEM, *P < 0.05, **P < 0.01, ***P < 0.001 compared to the control group; +p < 0.05, ++p < 0.01, +++p < 0.001 compared to MB group. #p < 0.05, ##p < 0.01, ###p < 0.001 compared to MB + IAA group
Fig. 8
Fig. 8
Effects of IAA on inflammatory response and cell neurotoxicity induced by LPS in BV-2 cells. (a) Representative immunofluorescence images showing relative expression of RAGE (green) and its co-localization with microglia marker Iba1 (red) in the GCL, IPL and INL of mice retinal cross-sections. The graph on the right demonstrates the IOD of RAGE in retina at 14 days post MB injection with or without IAA. n = 4. Bar = 50 μm. (b) Schematic illustration of the experimental design of BV-2 conditioned medium assay. (c) Representative western blot showing the protein expression levels of RAGE, IL1β and TNFα in PBS, D-Ribose and D-Ribose + FPS-zm1 groups. Quantitative data of proteins were measured and normalized to beta-tubulin. PBS group, n = 4; D-Ribose group, n = 6; D-Ribose + FPS-zm1 group, n = 6. *P < 0.05, **P < 0.001, ***P < 0.001. (d) Representative western blot showing the protein expression levels of RAGE, iNOS, p-NFκB, TNFα, IL1β, IL6 in control, LPS, LPS + IAA, LPS + IAA + CH, LPS + IAA + Rib, LPS + PDTC groups. (e-j) Quantitative data of proteins in (d) were normalized to beta-tubulin. control, LPS and LPS + IAA groups, n = 4; LPS + IAA + CH, LPS + IAA + Rib, LPS + PDTC groups, n = 6. *P < 0.05, **P < 0.01, ***P < 0.001 compared to the control group; +p < 0.05, ++p < 0.01, +++p < 0.001 compared to LPS group. #p < 0.05, ##p < 0.01, ###p < 0.001 compared to LPS + IAA group. (k) Optical and immunofluorescent images of primary retinal neurons, RGCs were labeled by βIII-tubulin (green). Bar = 50 μm. (l) immunofluorescence of live (green)/dead (red) retinal neurons following CM treatment. Bar = 25 μm. (m) Percentage of neurons survival in (l). n = 5. (n) Representative western blot showing the protein expression levels of cleaved-caspase3 and cleaved-caspase9 in primary retinal neurons treated with conditioned medium from control, LPS, LPS + IAA, LPS + IAA + CH, LPS + IAA + Rib, LPS + PDTC BV-2 groups. (o, p) Quantitative data of proteins in (n) were normalized to beta-tubulin. Control CM group, LPS CM group and LPS + IAA CM group, n = 6; LPS + IAA + CH CM group, LPS + IAA + Rib CM group, LPS + PDTC CM group, n = 5. ***P < 0.001 compared to the control CM group; +p < 0.05, ++p < 0.01, +++p < 0.001 compared to LPS CM group. #p < 0.05, ##p < 0.01, ###p < 0.001 compared to LPS + IAA CM group. Data are presented as mean ± SEM
Fig. 9
Fig. 9
RGCs damage in glaucoma were ameliorated via Gut microbiota-IAA-eye signaling pathway. Dysbiosis of tryptophan metabolism-related microbiota B. fragili leads to low level of its metabolite IAA in glaucoma. By in vivo and in vitro experiment we demonstrated supplement of B.fragilis or IAA could activate AhR and inhibit RAGE/NFκB to suppress retinal neuroinflammation and neurotoxicity, and ultimately relieved the progression of RGCs loss

Similar articles

References

    1. Jayaram H, Kolko M, Friedman DS, Gazzard G. Glaucoma: now and beyond. Lancet. 2023;402:1788–801. 10.1016/S0140-6736(23)01289-8 - PubMed
    1. Jonas JB, Aung T, Bourne RR, Bron AM, Ritch R, Panda-Jonas S, Glaucoma. Lancet. 2017;390:2183–93. 10.1016/s0140-6736(17)31469-1 - PubMed
    1. Jameson KG, Olson CA, Kazmi SA, Hsiao EY. Toward Understanding Microbiome-Neuronal signaling. Mol Cell. 2020;78:577–83. 10.1016/j.molcel.2020.03.006 - PubMed
    1. Niso-Santano M, Fuentes JM, Galluzzi L. Immunological aspects of central neurodegeneration. Cell Discov. 2024;10. 10.1038/s41421-024-00666-z - PMC - PubMed
    1. Hassan A, Huang Y, Mahjabina, Sudiro OH, Wang X, He J, Wei Y, Liao X, Wang G. Emerging role of gut microbiota extracellular vesicle in neurodegenerative disorders and insights on their therapeutic management. iMetaOmics 1. 10.1002/imo2.33 (2024).

MeSH terms

LinkOut - more resources