

Protein quantitative trait locus analysis in African American and non-Hispanic White individuals
- PMID: 40640959
- PMCID: PMC12243311
- DOI: 10.1186/s13059-025-03671-x
Protein quantitative trait locus analysis in African American and non-Hispanic White individuals
Abstract
Background: Substantial efforts have been dedicated to exploring the link between genetic regulation and the proteome, informing studies of complex trait mechanisms. Most of these efforts have been limited to populations of European ancestry.
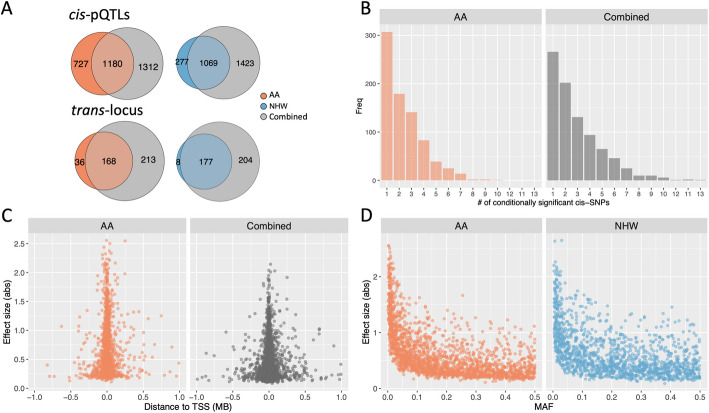
Results: We conduct an Olink protein quantitative trait locus (pQTL) analysis on 1245 proteins involving 1033 self-identified African American (AA) and 1764 non-Hispanic White (NHW) participants from the Women's Health Initiative and Framingham Heart Study. For replication of candidate pQTLs, we use data from 534 self-identified AA adults from the Jackson Heart Study and protein genome-wide association analysis statistics from the UK Biobank Pharma Proteomics Project, including 54,219 participants, of whom 931 are of African ancestry. In total, we identify and validate 5103 pQTLs (4496 or 88% cis- and 602 or 12% trans-pQTLs) for 983 proteins. Among these, 195 are previously unreported, with most (166 or 85%) identified in our AA sample, many of which were essentially monomorphic in European reference populations. Several of these newly identified African ancestry-specific pQTLs have been reported in ClinVar; our results suggest impact on circulating protein levels, potentially bolstering evidence for clinical significance. We identify a "cis pQTL hotspot" within the leukocyte receptor gene cluster on human chromosome 19q13.4. We also provide examples where a particular cis-pQTL, identified through conditional analysis, offers biological insights into an overlapping GWAS signal for disease susceptibility.
Conclusions: The identification of previously undescribed African ancestry-specific pQTLs contributes to understanding protein genetic regulation and highlights the significance of proteomic analysis in diverse populations.
Keywords: Olink; Proteomics; Whole genome sequencing.
© 2025. The Author(s).
Conflict of interest statement
Declarations. Ethics approval: No new ethical approval or consent was required for this study. All data were obtained from existing studies (WHI, FHS, JHS) with prior institutional review board (IRB) approval and participant consent. Competing interests: Laura M. Raffield is a consultant for the TOPMed Administrative Coordinating Center (through Westat). Nora Franceschini is a Guest Editor for the collection but remained independent of the peer review process. The other authors declare no competing interests. Peer review information: Tim Sands was the primary editor of this article and managed its editorial process and peer review in collaboration with the rest of the editorial team. The peer-review history is available in the online version of this article.
Figures
References
-
- Ferkingstad E, Sulem P, Atlason BA, Sveinbjornsson G, Magnusson MI, Styrmisdottir EL, et al. Large-scale integration of the plasma proteome with genetics and disease. Nat Genet. 2021;53(12):1712–21. - PubMed
MeSH terms
Grants and funding
LinkOut - more resources
Full Text Sources
