. 2025 Aug;16(4):e70005.
doi: 10.1002/jcsm.70005.

Late-Stage Skeletal Muscle Transcriptome in Duchenne Muscular Dystrophy Shows a BMP4-Induced Molecular Signature

Affiliations

Late-Stage Skeletal Muscle Transcriptome in Duchenne Muscular Dystrophy Shows a BMP4-Induced Molecular Signature

Hanna Sothers et al. J Cachexia Sarcopenia Muscle. 2025 Aug.

Abstract

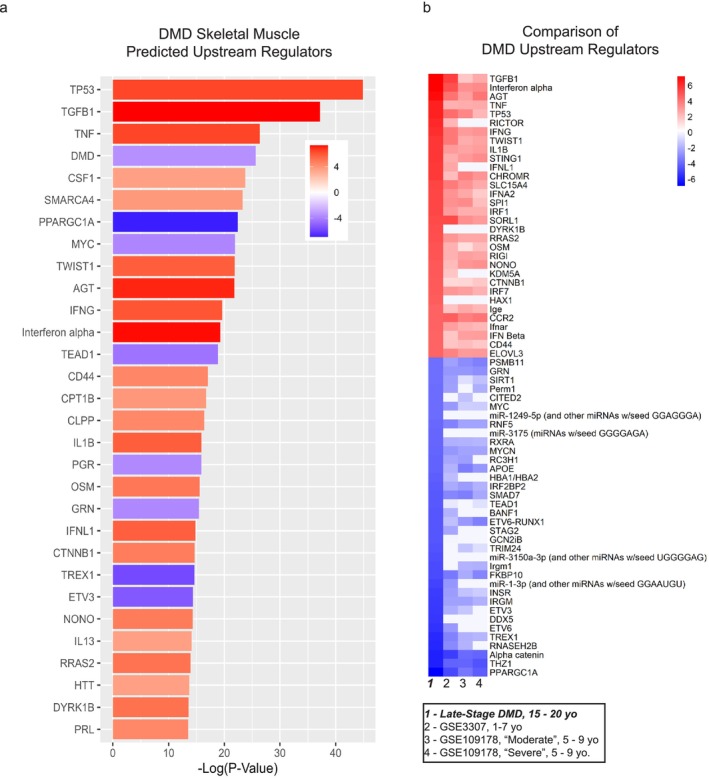
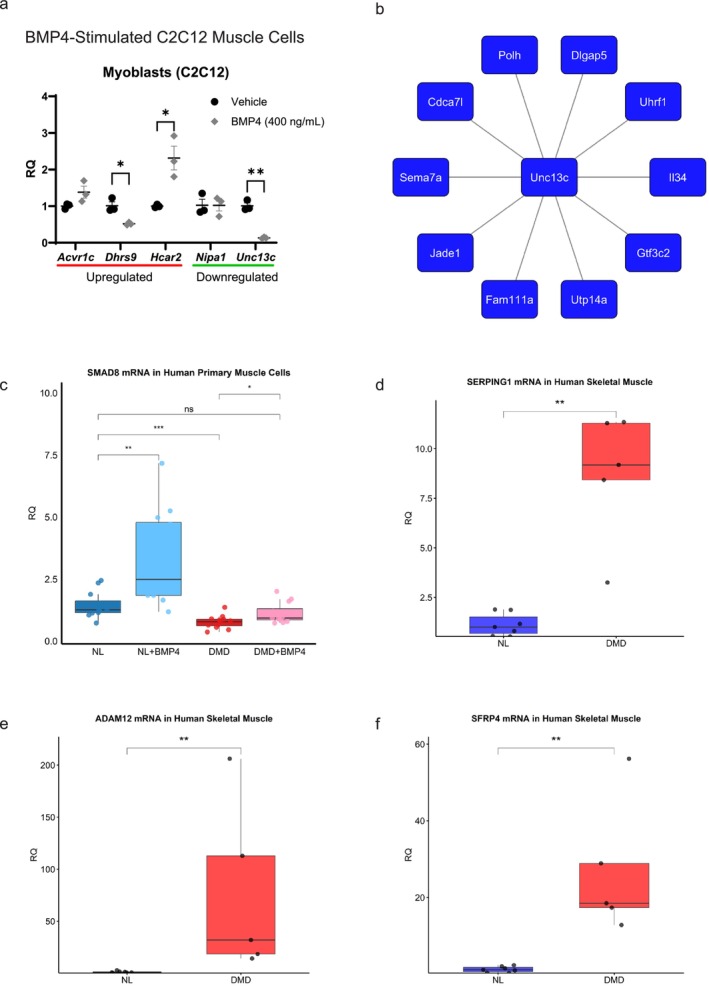
Background: Duchenne muscular dystrophy (DMD) is a fatal X-linked recessive disease due to loss-of-function variants in the DYSTROPHIN gene. DMD-related skeletal muscle wasting is typified by an aberrant immune response involving upregulation of the TGFβ family of cytokines, like TGFβ1 and BMP4. We previously demonstrated that bone morphogenetic protein 4 (BMP4) is increased in DMD and BMP4 stimulation induces a 20-fold upregulation of Smad8 transcription in muscle cells. However, the role of BMP4 in late-stage DMD skeletal muscle is unknown. We hypothesized that BMP4 signalling is a driver of aberrant gene expression in late-stage human DMD skeletal muscle detectable by a transcriptomic signature.

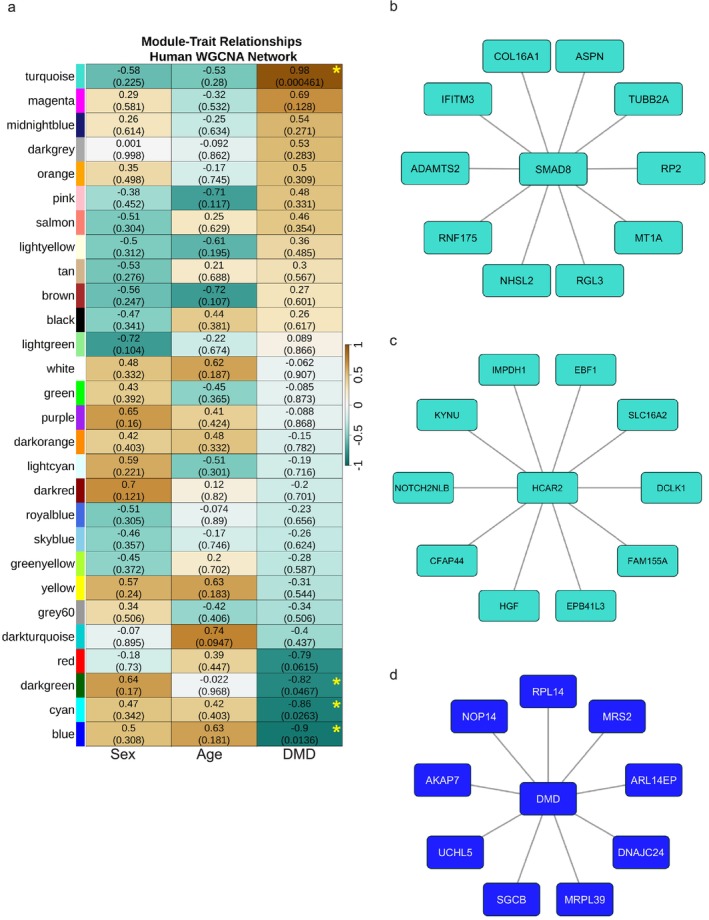
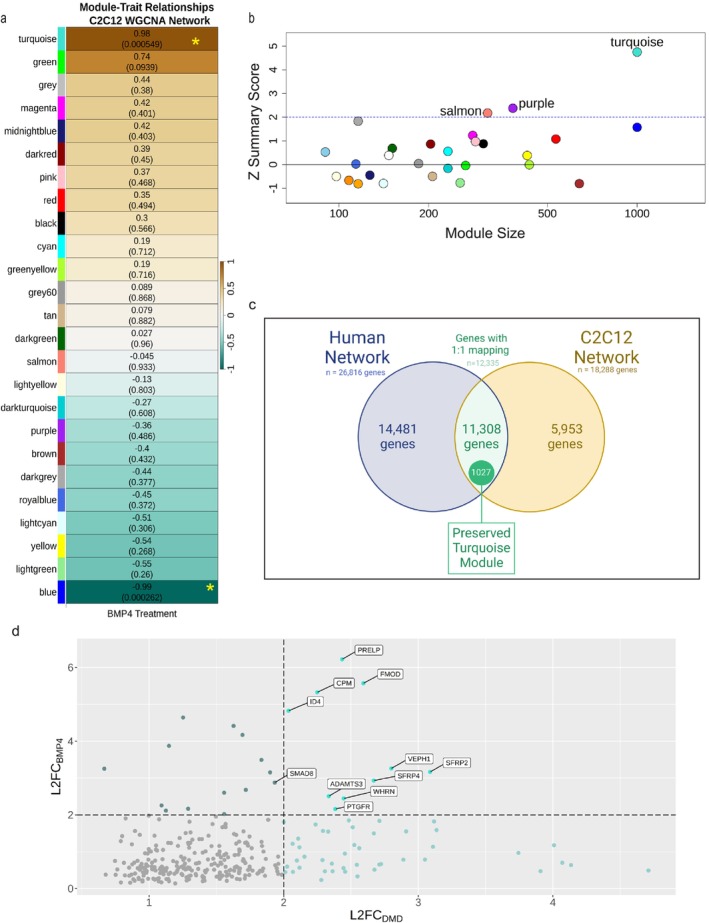
Methods: Transcriptomes from skeletal muscle biopsies of late-stage DMD versus non-DMD controls and C2C12 muscle cells with or without BMP4 stimulation were generated using RNA-Seq. We tested transcriptional differences at the single transcript level in skeletal muscle biopsy samples from three patients with DMD and compared them to three non-DMD. They were then analyzed by Ingenuity Pathway Analysis, weighted gene coexpression network analyses (WGCNA) and Gene Set Enrichment Analysis (GSEA). Key hub and high-fold change genes overlapping in the DMD and BMP4 muscle transcriptomes were validated in additional primary and bulk skeletal muscle samples.

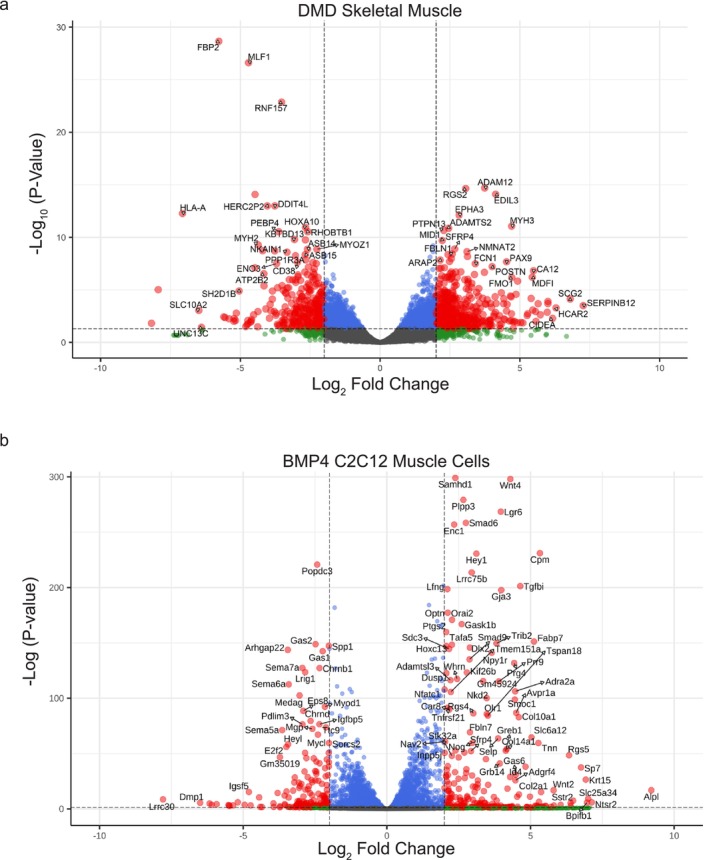
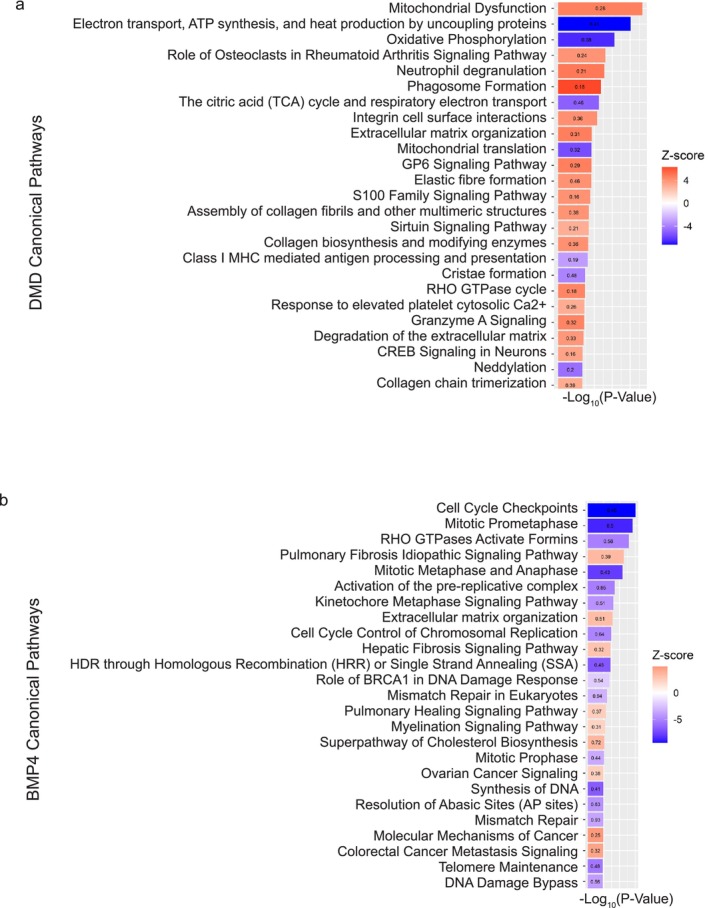
Results: A total of 3048 transcripts in the human muscle and 5291 transcripts in C2C12 muscle cells were differentially expressed. WGCNA identified an overlapping molecular signature of 1027 genes dysregulated in DMD muscle that were induced in BMP4-stimulated C2C12 muscle cells. SERPING1 and Aff3 were identified as the top hub genes. Highly upregulated DMD muscle transcripts that overlapped with BMP4-stimulated C2C12 muscle cells included ADAM12, SERPING1, SMAD8 and SFRP4. DMD skeletal muscle analysis showed aberrant upregulation of TGFβ signalling, extracellular matrix remodelling and collagen biosynthesis pathways, in contrast to inhibited mitochondrial and metabolic pathways.

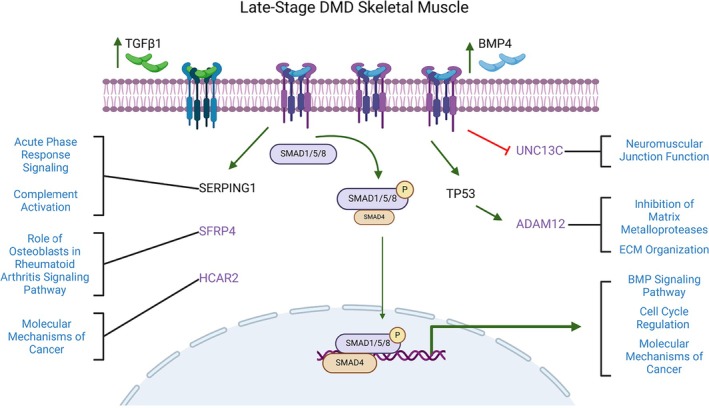
Conclusions: In summary, the DMD transcriptome was characterized by dysregulation of immune function, ECM remodelling and muscle bioenergetic metabolism. We additionally define a late-stage DMD skeletal muscle transcriptome that overlaps with a BMP4-induced molecular signature in C2C12 muscle cells. This supports BMP4/Smad8 pathway as a disease-driving regulator of transcriptomic changes in late-stage DMD skeletal muscle. Further exploration of this cross-species transcriptomic signature may expand our understanding of the evolution of dystrophic signalling pathways and the associated gene networks, which could be evaluated for therapeutic development.

Keywords: BMP4; SMAD8; TGFβ1; Duchenne muscular dystrophy.


Conflict of interest statement

M.A.L. served as Principal Investigator on a clinical trial and participated in scientific advisory boards for Sarepta Therapeutics Inc. All other authors declare no conflicts of interest.

Figures

FIGURE 1
FIGURE 1
RNA‐seq analysis showing differential gene expression of DMD muscle and BMP4‐stimulated C2C12 muscle cells. (a) Volcano plot of DMD skeletal muscle transcriptome showing −log10 of adjusted p value versus log2‐fold change. Dashed vertical lines mark log2‐fold change > |2|. Dashed horizontal line marks adjusted p value < 0.05. Red indicates significant and > |2| log2‐fold change. Blue indicates significant but log2‐fold change < |2|. Green indicates not significant and log2‐fold change > |2|. Grey indicates not significant and log2‐fold change < |2|. (b) Volcano plot of BMP4‐stimulated C2C12 muscle cells (C2C12) transcriptome showing −log10 of adjusted p value versus. log2‐fold change. Dashed vertical lines mark log2‐fold change > |2|. Dashed horizontal line marks adjusted p value < 0.05. Red indicates significant and > |2|log2‐fold change. Blue indicates significant but log2‐fold change < |2|. Green indicates not significant and log2‐fold change > |2|. Grey indicates not significant and log2‐fold change < |2|.
FIGURE 2
FIGURE 2
Ingenuity Pathway Analysis (IPA) predicted activated or inhibited canonical pathways. (a) DMD skeletal muscle IPA canonical pathways. Heat maps show Z scores for each canonical pathway ordered by −log10 of adjusted p value. The top 25 canonical pathways with Z scores > |3.0| were selected for comparison. Bars are labelled with the ratio of the number of overlapping genes within the canonical pathway. (b) BMP4‐stimulated C2C12 muscle cell canonical pathways predicted by IPA. Heat maps show Z scores for each canonical pathway ordered by −log10 of adjusted p value. The top 25 canonical pathways with Z scores >| 2| were selected for comparison. Bars are labelled with the ratio of the number of overlapping genes within the canonical pathway. Z‐score statistics indicate predicted state as activated (red) or inhibited (blue).
FIGURE 3
FIGURE 3
DMD skeletal muscle Ingenuity Pathway Analysis (IPA) predicted upstream regulators. (a) DMD upstream regulators are shown in heat maps with Z scores for each upstream regulator ordered by −log10 of adjusted p value. The top 30 upstream regulators with Z scores > |3.5| were selected for comparison. Z‐score statistics show predicted activated (red) or inhibited (blue) upstream regulators. (b) Heat map shows comparison of predicted upstream regulators from late‐stage DMD skeletal muscle transcriptome (1) with younger DMD muscle arrays that were identified by analysis match (2) GSE3307, (3) GSE109178/moderate and (4) GSE109178/severe. Z‐score statistics show predicted state as activated (red) or inhibited (blue).
FIGURE 4
FIGURE 4
Weighted Gene Correlation Network Analysis of DMD muscle transcriptome. (a) Heat map of correlations between the module eigengenes and the DMD disease trait. Modules are labelled with Z score and (p value). Yellow * indicates p value < 0.05 for DMD trait. Z scores indicate upregulated (+) or downregulated (−) coexpression for each module. Colours are arbitrarily assigned. (b) Top connected genes coexpressed with SMAD8 with edge weight (from adjacency matrix) ≥ 0.40 in the TurquoiseDMD (upregulated) module. (c) HCAR2 coexpressed genes with edge weights (from adjacency matrix) ≥ 0.40. (d) Top 10 genes coexpressed with the DMD transcript in downregulated BlueDMD module based on edge weight ≥ 0.45.
FIGURE 5
FIGURE 5
Weighted Gene Correlation Network Analysis of BMP4‐stimulated C2C12 transcriptome and comparison to DMD transcriptome. (a) Heat map showing correlation between the module eigengenes and BMP4‐stimulated C2C12 muscle cells. Modules are labelled with Z score and p value. Yellow * indicates p value < 0.05. Z scores indicate upregulated (+) or downregulated (−) coexpression for each module. Colours are arbitrarily assigned. (b) Module preservation analysis between the DMD and BMP4‐stimulated C2C12 muscle cells showing Z‐summary preservation statistic for each module and module size. The Turquoisepreserved module was moderately preserved with a Z‐summary score of 4.7. (c) Venn diagram of overlapping genes in the Turquoisepreserved module. A total of 12 335 genes showed a 1‐to‐1 mapping between the human and C2C12 networks of which 1027 were in the Turquoisepreserved module. (d) Plot of the log2 fold change from the DMD muscle transcriptome (LOG2FCDMD) and the BMP4‐simulated C2C12 transcriptome (LOG2FCBMP4) for genes present in the Turquoisepreserved module with an FDR < 0.05. Dashed lines indicate transcripts with LOG2FC > 2. Selected transcripts are labelled demonstrating high LOG2FC.
FIGURE 6
FIGURE 6
DMD dysregulated mRNA targets regulated by BMP4. (a) Plot shows mRNA expression levels (RQ) of Acvr1c, Dhrs9, Hcar2, Nipa1 and Unc13c after BMP4 stimulation of C2C12 muscle cell as measured by quantitative RT‐PCR (qPCR). Bars show mean ± SEM of three biological replicates per group. p values compared to vehicle *< 0.05 and **< 0.01. Transcripts underlined in red and blue note their upregulation or downregulation, respectively, in the DMD transcriptome. (b) Unc13c coexpressed genes with edge weight (from adjacency matrix) ≥ 50th percentile (0.387) of adjacency matrix values. (c) SMAD8 mRNA is increased by BMP4 in both normal (N = 3 cell lines) and DMD (N = 3 cell lines) primary skeletal muscle cells in growth conditions. Experiments repeated in triplicate. (d–f) SERPING1, ADMA12 and SFRP4 mRNA are increased in human DMD skeletal muscle compared to normal muscle (NL). RQ, relative quantity, reference genes: (a) Gapdh and (c–f) RPS9. Box and whisker plots show median line, interquartile range (IQR) and whiskers extending to 1.5 IQR. p values: *< 0.05, **< 0.01, ***< 0.001 and ****< 0.0001. A t test is used for (a) and Wilcoxon test is performed for (c)–(f).
FIGURE 7
FIGURE 7
Model of late‐stage DMD skeletal muscle transcriptomic changes in TGFβ signalling pathway. Blue text indicates disease processes or canonical pathway. Purple text indicates BMP4‐induced regulation. SERPING1 and TP53 were identified as a key hub gene and an upstream regulator, respectively. Arrows and lines indicate activation (green) or inhibition (red). Illustration created in Biorender.

Update of

Similar articles

References

    1. Hoffman E. P., R. H. Brown, Jr. , and Kunkel L. M., “Dystrophin: The Protein Product of the Duchenne Muscular Dystrophy Locus,” Cell 51, no. 6 (1987): 919–928. - PubMed
    1. Rosenberg A. S., Puig M., Nagaraju K., et al., “Immune‐Mediated Pathology in Duchenne Muscular Dystrophy,” Science Translational Medicine 7, no. 299 (2015): 299rv4. - PMC - PubMed
    1. Nishio H., Takeshima Y., Narita N., et al., “Identification of a Novel First Exon in the Human Dystrophin Gene and of a New Promoter Located More Than 500 kb Upstream of the Nearest Known Promoter,” Journal of Clinical Investigation 94, no. 3 (1994): 1037–1042. - PMC - PubMed
    1. Chen Y. W., Nagaraju K., Bakay M., et al., “Early Onset of Inflammation and Later Involvement of TGFbeta in Duchenne Muscular Dystrophy,” Neurology 65, no. 6 (2005): 826–834. - PubMed
    1. Mázala D. A., Novak J. S., Hogarth M. W., et al., “ TGF‐β‐Driven Muscle Degeneration and Failed Regeneration Underlie Disease Onset in a DMD Mouse Model,” JCI Insight 5, no. 6 (2020): e135703. - PMC - PubMed

MeSH terms

Substances

LinkOut - more resources