. 2025 Sep;32(3):249.
doi: 10.3892/mmr.2025.13614. Epub 2025 Jul 11.

Identification and validation of epithelial‑mesenchymal transition‑related genes for diabetic nephropathy by WGCNA and machine learning

Affiliations

Identification and validation of epithelial‑mesenchymal transition‑related genes for diabetic nephropathy by WGCNA and machine learning

Huidi Tang et al. Mol Med Rep. 2025 Sep.

Abstract

Diabetic nephropathy (DN) is the main cause of end‑stage renal disease, with epithelial‑mesenchymal transition (EMT) serving a key role in its initiation and progression. Nevertheless, the precise mechanisms involved remain unidentified. The present study aimed to identify the involvement of EMT‑related genes in the advancement of DN. Using the Gene Expression Omnibus database and the dbEMT 2.0 database, EMT‑related differentially expressed genes (DEGs) associated with DN were identified. Key EMT‑related genes were subjected to weighted gene co‑expression network analysis, machine learning and protein‑protein interaction network analyses and validated against validation datasets from GEO database. Receiver operating characteristic analysis was used to assess the diagnostic performance of these hub genes. To delve into their cellular clustering in DN, single‑nucleus RNA sequencing was conducted using the Kidney Integrative Transcriptomics database. Additionally, the CIBERSORT algorithm was used to determine the proportion of immune cell infiltration in DN samples. Reverse transcription‑quantitative PCR (RT‑qPCR) was used to assess the mRNA expression of fibronectin 1 (FN1) in the kidney of mice and patients with DN. After silencing FN1, the expression changes of EMT markers (E‑cadherin and vimentin) were detected by RT‑qPCR. FN1 was upregulated in DN, demonstrating good diagnostic performance according to ROC analysis. FN1 was associated with infiltration of immune cells. RT‑qPCR confirmed the increased expression of FN1 in the kidney of mice with DN and in the renal biopsy samples of patients with DN. After silencing FN1, the expression of E‑cadherin was upregulated, while the expression of vimentin was downregulated, indicating that EMT was inhibited. The present study identified FN1 as a diagnostic marker for DN. FN1 may serve key roles in the initiation and progression of DN by participating in EMT and upregulating various types of immune cells.

Keywords: FN1; clustering analysis; diabetic nephropathy; immune cell infiltration; machine learning; weighted gene co‑expression network analysis.


Conflict of interest statement

The authors declare that they have no competing interests.

Figures

Figure 1. Identification of DEGs in dataset no. GSE96804 from the Gene Expression Omnibus database. (A) Volcano plot of DEGs in dataset GSE96804. (B) Heatmap of DEGs. (C) UMAP illustrating the differe...
Figure 1.
Identification of DEGs in dataset no. GSE96804 from the Gene Expression Omnibus database. (A) Volcano plot of DEGs in dataset GSE96804. (B) Heatmap of DEGs. (C) UMAP illustrating the different groups. DEG, differentially expressed gene; DN, diabetic nephropathy; UMAP, uniform manifold approximation and projection.
Figure 2. Construction of the co–expression network. (A) β =11 was selected as the soft threshold with the combined analysis of scale independence and mean connectivity based on top 25% of genes with...
Figure 2.
Construction of the co-expression network. (A) β=11 was selected as the soft threshold with the combined analysis of scale independence and mean connectivity based on top 25% of genes with the highest variance. (B) Gene hierarchy tree-clustering diagram. Colors represent different module genes. (C) Heatmap of the correlation between module genes and phenotypes. (D) Venn diagram of the module genes from WGCNA, differentially expressed in GSE96804 and EMT-related genes. EMT, epithelial-mesenchymal transition; WGCNA, weighted gene co-expression network analysis.
Figure 3. Screening of potential small molecule compounds for the treatment of diabetic nephropathy via CMap database. (A) Top 10 compounds with the most significantly negative connectivity scores acr...
Figure 3.
Screening of potential small molecule compounds for the treatment of diabetic nephropathy via CMap database. (A) Top 10 compounds with the most significantly negative connectivity scores across 9 different cell lines. (B) Chemical structures of compounds. CMap, connectivity map; pc, principal component.
Figure 4. Screening hub genes using the STRING database by intersecting the top genes obtained from degree, MCC and MNC algorithms. (A) Protein–protein interaction network. Top 10 genes based on (B) d...
Figure 4.
Screening hub genes using the STRING database by intersecting the top genes obtained from degree, MCC and MNC algorithms. (A) Protein-protein interaction network. Top 10 genes based on (B) degree, (C) MCC and (D) MNC. (E) Venn diagram of the genes screened from degree, MCC and MNC. MNC, maximum neighborhood component; MCC, maximal clique centrality.
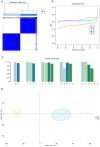
Figure 5. Potential molecular subtypes of diabetic nephropathy based on hub genes from dataset no. GSE96804 of the Gene Expression Omnibus. (A) Consensus matrix heatmap when k=2. (B) Representative CD...
Figure 5.
Potential molecular subtypes of diabetic nephropathy based on hub genes from dataset no. GSE96804 of the Gene Expression Omnibus. (A) Consensus matrix heatmap when k=2. (B) Representative CDF curves. (C) Score of consensus clustering. (D) Principal component analysis plot of the distribution of two clusters. CDF, cumulative distribution function; Dim, dimension
Figure 6. Identification of diagnostic markers using machine learning to conduct validation. (A) Least absolute shrinkage and selection operator regression algorithm. (B) Support vector machine recurs...
Figure 6.
Identification of diagnostic markers using machine learning to conduct validation. (A) Least absolute shrinkage and selection operator regression algorithm. (B) Support vector machine recursive feature elimination algorithm. (C) Expression of diagnostic markers in the GSE47183 and GSE104948 datasets from Gene Expression Omnibus. *P<0.05, **P<0.01. (D) ROC curve analysis of diagnostic markers in the GSE47183 and GSE104948 datasets. DN, diabetic neuropathy; AUC, area under the curve; CI, confidence interval; CV, cross validation; TPR, true positive rate; FPR, false positive rate.
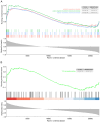
Figure 7. Gene set enrichment analysis of FN1. Co–enriched (A) Gene Ontology terms and (B) Kyoto Encyclopedia of Genes and Genomes pathways.
Figure 7.
Gene set enrichment analysis of FN1. Co-enriched (A) Gene Ontology terms and (B) Kyoto Encyclopedia of Genes and Genomes pathways.
Figure 8. Single nucleus RNA sequencing from the Kidney Integrative Transcriptomics database. (A) Annotation of cluster subtypes. (B) Expression distribution of FN1. (C) Percent expression of FN1 in c...
Figure 8.
Single nucleus RNA sequencing from the Kidney Integrative Transcriptomics database. (A) Annotation of cluster subtypes. (B) Expression distribution of FN1. (C) Percent expression of FN1 in cell clusters. PCT, proximal convoluted tubule; CD, collecting duct; ICA, Type A intercalated cell; PEC, parietal epithelial cell; PC, principal cell; DCT, distal convoluted tubule; CT, connecting tubule; LOH, loop of Henle; PODO, podocyte; ENDO, endothelium; MES, mesangial cell; LEUK, leukocyte; tSNE, t-distributed stochastic neighbor embedding; FN1, fibronectin 1; CTRL, control.
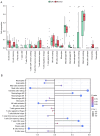
Figure 9. Immune cell infiltration analysis based on dataset GSE96804 from the Gene Expression Omnibus database. (A) Infiltrating immune cells in DN and normal samples. (B) Spearman's correlation anal...
Figure 9.
Immune cell infiltration analysis based on dataset GSE96804 from the Gene Expression Omnibus database. (A) Infiltrating immune cells in DN and normal samples. (B) Spearman's correlation analysis of FN1 and immune cells. *P<0.05, **P<0.01 and ***P<0.001. DN, diabetic neuropathy; NK, natural killer; FN1, fibronectin 1; Cor, correlation.
Figure 10. Validation of the expression of FN1 in the kidney of mice with DN and in patients with DN. Relative expression of FN1 mRNA in (A) kidney of mice (n=6) and (B) human kidney renal biopsy samp...
Figure 10.
Validation of the expression of FN1 in the kidney of mice with DN and in patients with DN. Relative expression of FN1 mRNA in (A) kidney of mice (n=6) and (B) human kidney renal biopsy samples. Relative expression levels of (C) FN1, (D) E-cadherin and (E) vimentin in HK-2 cells (n=3). Data are expressed as the mean ± SD. *P<0.05. FN1, fibronectin 1; siRNA, small interfering RNA; DN, diabetic neuropathy.

Similar articles

References

    1. Webster AC, Nagler EV, Morton RL, Masson P. Chronic kidney disease. Lancet. 2017;389:1238–1252. doi: 10.1016/S0140-6736(16)32064-5. - DOI - PubMed
    1. Pozo Garcia L, Thomas SS, Rajesh H, Navaneethan SD. Progress in the management of patients with diabetes and chronic kidney disease. Curr Opin Nephrol Hypertens. 2022;31:456–463. doi: 10.1097/MNH.0000000000000811. - DOI - PMC - PubMed
    1. Umanath K, Lewis JB. Update on diabetic nephropathy: Core curriculum 2018. Am J Kidney Dis. 2018;71:884–895. doi: 10.1053/j.ajkd.2017.10.026. - DOI - PubMed
    1. Flyvbjerg A. The role of the complement system in diabetic nephropathy. Nat Rev Nephrol. 2017;13:311–318. doi: 10.1038/nrneph.2017.31. - DOI - PubMed
    1. Tung CW, Hsu YC, Shih YH, Chang PJ, Lin CL. Glomerular mesangial cell and podocyte injuries in diabetic nephropathy. Nephrology (Carlton) 2018;23((Suppl 4)):S32–S37. doi: 10.1111/nep.13451. - DOI - PubMed

MeSH terms