. 2025 Sep;32(3):255.
doi: 10.3892/mmr.2025.13620. Epub 2025 Jul 11.

Roles of human SPATA3 in cell proliferation and expression pattern of Spata3 in mouse testis

Affiliations

Roles of human SPATA3 in cell proliferation and expression pattern of Spata3 in mouse testis

Li Fu et al. Mol Med Rep. 2025 Sep.

Abstract

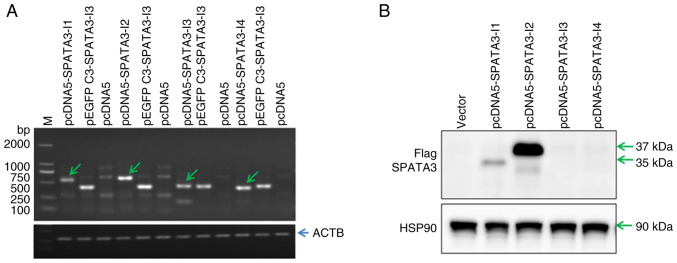
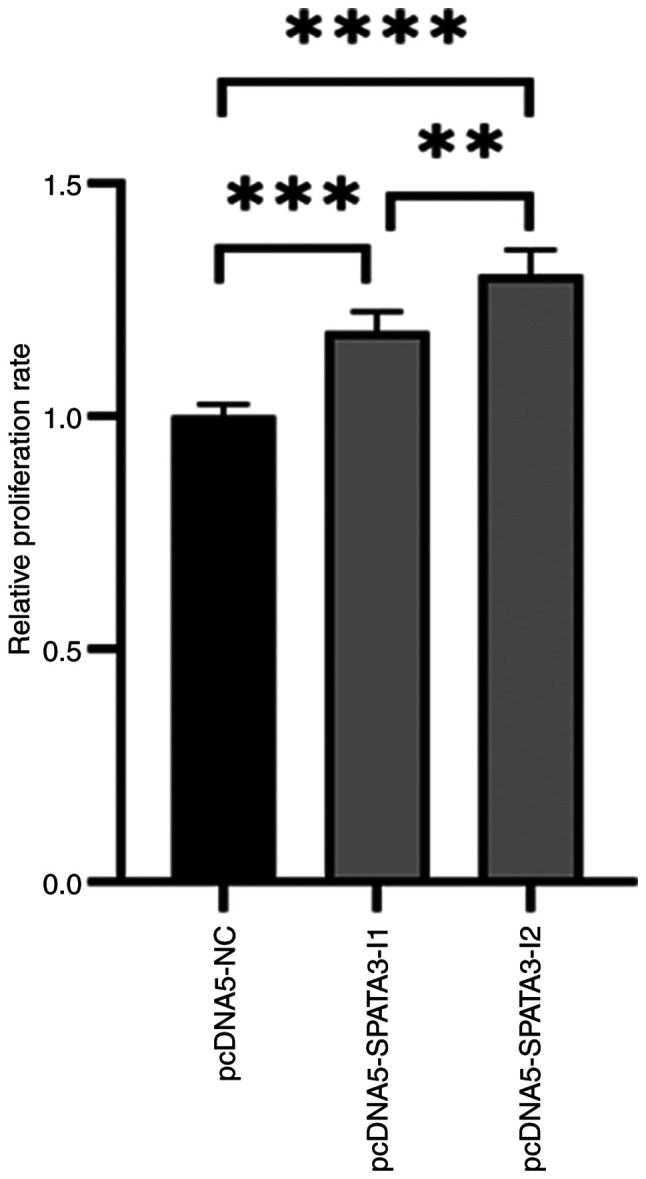
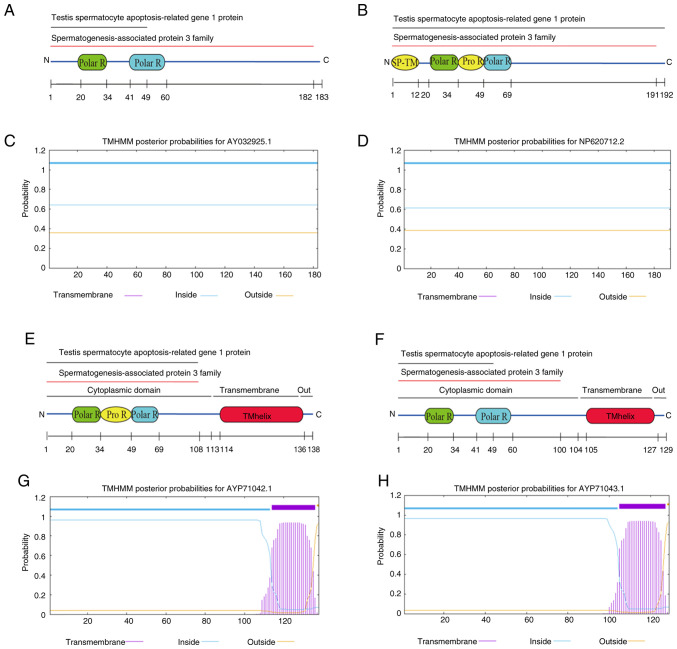
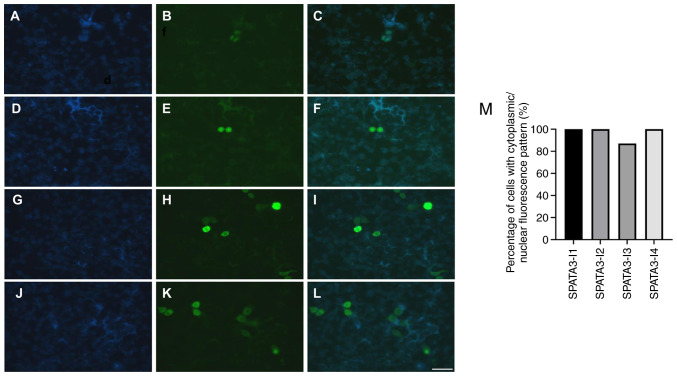
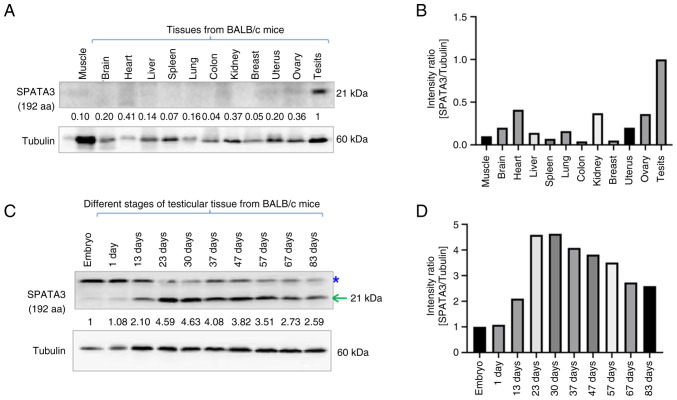
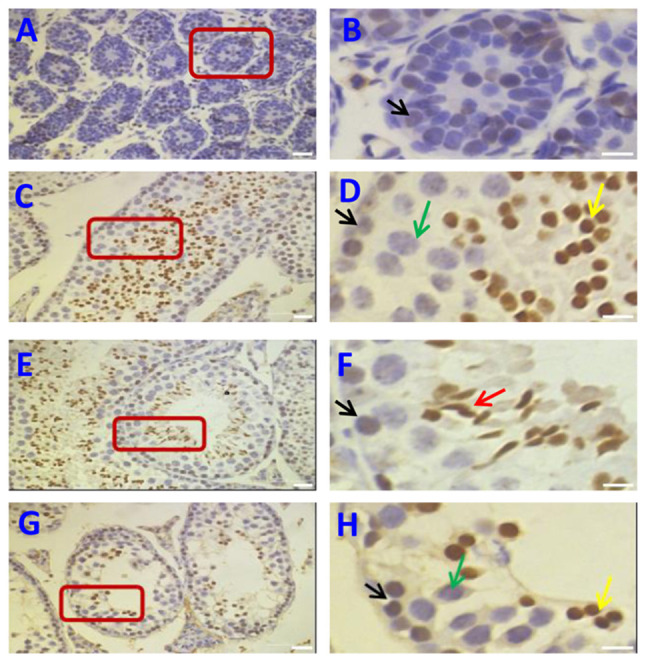
Male infertility predominantly manifests as abnormal spermatogenesis and maturation, abnormal semen quality, chromosomal abnormalities, and endocrine dysfunction. The present study aimed to explore the role, expression pattern and localization of spermatogenesis‑associated protein 3 (SPATA3) in the testis, and to analyze its spatiotemporal expression and function. Using previously acquired plasmids as templates, recombinant plasmids of different SPATA3 isoforms were constructed. Cell Counting Kit‑8 assay was used to analyze cell proliferation. Reverse transcription‑PCR and western blotting were used to determine the mRNA and protein expression levels, respectively. Different SPATA3 isoforms were induced to be overexpressed, among which SPATA3‑I1 and SPATA3‑I2 promoted cell proliferation. The subcellular localization results indicated that the green fluorescent protein fusion proteins of various isoforms were mainly localized in the nucleus. However, the fluorescence of the fusion proteins pEGFP‑C3‑SPATA3‑I3 and pEGFP‑C3‑SPATA3‑I4 tended to be distributed in the cytoplasm, accompanied by a decrease in nuclear fluorescence. Additionally, the SPATA3‑I2 isoform protein displayed notable tissue‑specific expression in testes. Notably, the SPATA3‑I2 isoform protein was not expressed in embryos or during the early development stage of the mice, yet it was highly expressed in the testes of mice aged 23‑57 days (3‑8 weeks). Immunohistochemistry revealed that the SPATA3‑I2 isoform protein was located mainly in round and elongated spermatids within the spermatogenic epithelial cells. In conclusion, the findings highlighted that SPATA3 isoforms had differential subcellular localizations and that SPATA3‑I2 exhibited a specific spatiotemporal expression pattern, suggesting its association with spermatogenesis and sperm maturation.

Keywords: isoforms; male infertility; spermatogenesis; spermatogenesis‑associated protein 3; subcellular localization; tissue‑specific expression.


Conflict of interest statement

The authors declare that they have no competing interests.

Figures

Figure 1. RT–PCR and western blotting results for SPATA3 isoform expression in HeLa cells transfected with pcDNA5 or pEGFP–C3 vectors containing SPATA3 isoforms. (A) RT–PCR analysis of SPATA3 isoform ...
Figure 1.
RT-PCR and western blotting results for SPATA3 isoform expression in HeLa cells transfected with pcDNA5 or pEGFP-C3 vectors containing SPATA3 isoforms. (A) RT-PCR analysis of SPATA3 isoform mRNA expression in HeLa transfected with pcDNA5 or pEGFP-C3 vectors containing SPATA3 isoforms. The green arrows indicate the expression of SPATA3-I1, SPATA3-I2, SPATA3-I3 and SPATA3-I4 mRNAs, and the corresponding fragment sizes are 552, 576, 418 and 418 bp, respectively. The pcDNA5 vector served as a negative control. ACTB served as an internal control. (B) Western blotting results of SPATA3 isoform protein expression in HeLa cells transfected with pcDNA5 vectors containing SPATA3 isoforms. Hsp90 served as an internal control. Vector, overexpression of the empty vector pcDNA5; RT-PCR, reverse transcription-PCR; SPATA3, spermatogenesis-associated protein 3; HSP90, heat shock protein 90.
Figure 2. SPATA3 promotes HeLa cell proliferation in vitro . Relative proliferation rates of HeLa cells transfected with pcDNA5–SPATA3–I1, pcDNA5–SPATA3–I2 or the empty vector pcDNA5 a t 48 h post–tra...
Figure 2.
SPATA3 promotes HeLa cell proliferation in vitro. Relative proliferation rates of HeLa cells transfected with pcDNA5-SPATA3-I1, pcDNA5-SPATA3-I2 or the empty vector pcDNA5 at 48 h post-transfection. **P<0.01, ***P<0.001, ****P<0.0001. SPATA3, spermatogenesis-associated protein 3; NC, negative control.
Figure 3. Domains, families and other features of SPATA3 isoforms. Schematic representation of domains, families and featur es in (A) SPATA3–I1. (B) Schematic representation of domains, families, and ...
Figure 3.
Domains, families and other features of SPATA3 isoforms. Schematic representation of domains, families and features in (A) SPATA3-I1. (B) Schematic representation of domains, families, and features in SPATA3-I2. (C) Transmembrane topology prediction for SPATA3-I1 generated by TMHMM 2.0. (D) Transmembrane topology prediction for SPATA3-I2 generated by TMHMM 2.0. (E) Schematic representation of domains, families, and features in SPATA3-I3. (F) Schematic representation of domains, families, and features in SPATA3-I4. (G) Transmembrane topology prediction for SPATA3-I3 generated by TMHMM 2.0. (H) Transmembrane topology prediction for SPATA3-I4 generated by TMHMM 2.0. SPATA3, spermatogenesis-associated protein 3; Polar R, polar residues; Pro R, pro residues; SP-TM, SignalP-TM; TMhelix, Transmembrane Helix.
Figure 4. Subcellular localization of overexpressed SPATA3 isoforms in HeLa cells. Cells overexpressing the pEGFP–C3–SPATA3–I1 isoform. (A) Hoechst 33258 staining. (B) GFP signals for overexpression o...
Figure 4.
Subcellular localization of overexpressed SPATA3 isoforms in HeLa cells. Cells overexpressing the pEGFP-C3-SPATA3-I1 isoform. (A) Hoechst 33258 staining. (B) GFP signals for overexpression of pEGFP-C3-SPATA3-I1 isoform; (C) Merged images of Hoechst 33258 staining and GFP signals. Cells overexpressing the pEGFP-C3-SPATA3-I2 isoform. (D) Hoechst 33258 staining; (E) GFP signals for overexpression of pEGFP-C3-SPATA3-I2 isoform; (F) Merged images of Hoechst 33258 staining and GFP signals. (G-I) Cells overexpressing the pEGFP-C3-SPATA3-I3 isoform. (G) Hoechst 33258 staining; (H) GFP signals for overexpression of pEGFP-C3-SPATA3-I3 isoform; (I) Merged images of Hoechst 33258 staining and GFP signals. (J-L) Cells overexpressing the pEGFP-C3-SPATA3-I4 isoform. (J) Hoechst 33258 staining; (K) GFP signals for overexpression of pEGFP-C3-SPATA3-I4 isoform; (L) Merged images of Hoechst 33258 staining and GFP signals. Scale bar, 50 µm. (M) Quantitative analysis of the sub-cellular localization of different SPATA3 isoforms. SPATA3, sperma to genesis-associated protein 3.
Figure 5. Western blot analysis of tissue–specific and stage–specific SPATA3 protein expression. (A) SPATA3 protein expression in various tissues of BALB / c mice and (B) semi–quantitative analysis. (...
Figure 5.
Western blot analysis of tissue-specific and stage-specific SPATA3 protein expression. (A) SPATA3 protein expression in various tissues of BALB/c mice and (B) semi-quantitative analysis. (C) SPATA3 protein expression in the testicular tissue of BALB/c mice at different developmental stages and (D) the associated semi-quantitative analysis. The arrow indicates the SPATA3 protein. The asterisk indicates nonspecific bands. SPATA3, spermatogenesis-associated protein 3.
Figure 6. Immunohistochemistry results of spermatogenesis–associated protein 3 in the testes of BALB / c mice. (A) General expression pattern in the testicular tissue of 2 – week – old mice. (B) The i...
Figure 6.
Immunohistochemistry results of spermatogenesis-associated protein 3 in the testes of BALB/c mice. (A) General expression pattern in the testicular tissue of 2 - week - old mice. (B) The images show a higher magnification of an area within red boxes in the left images. (C) The images show a general expression pattern in the testicular tissue of 8 - week - old mice. (D) The images show a higher magnification of an area within red boxes in the left images. (E) The images show a general expression pattern in the testicular tissue of 8 - week - old mice. (F) The images show a higher magnification of an area within red boxes in the left images. (G) The images show a general expression pattern in the testicular tissue of 19 - week - old mice. (H) The images show a higher magnification of an area within red boxes in the left images. The black arrows indicate spermatogonia, the green arrows indicate spermatocytes, the yellow arrows indicate round spermatids and the red arrow indicates elongated spermatids. Scale bar, 50 µm. (B, D, F and H) Scale bar, 20 µm.

Similar articles

References

    1. Rowe PJ, Comhaire FH, Hargreave B, Mahmoud AMA, editors. Cambridge University Press; Cambridge, UK: 2000. WHO Manual for the Standardized Investigation, Diagnosis and Management of the Infertile Male; p. pp91.
    1. Minhas S, Bettocchi C, Boeri L, Capogrosso P, Carvalho J, Cilesiz NC, Cocci A, Corona G, Dimitropoulos K, Gül M, et al. European association of urology guidelines on male sexual and reproductive health: 2021 update on male infertility. Eur Urol. 2021;80:603–620. doi: 10.1016/j.eururo.2021.08.014. - DOI - PubMed
    1. Agarwal A, Baskaran S, Parekh N, Cho CL, Henkel R, Vij S, Arafa M, Panner Selvam MK, Shah R. Male infertility. Lancet. 2021;397:319–333. doi: 10.1016/S0140-6736(20)32667-2. - DOI - PubMed
    1. Fu L, Wu Q, Fu J. Exploring the biological roles of DHX36, a DNA/RNA G-quadruplex helicase, highlights functions in male infertility: A comprehensive review. Int J Biol Macromol. 2024;268((Pt 2)):131811. doi: 10.1016/j.ijbiomac.2024.131811. - DOI - PubMed
    1. Eisenberg ML, Esteves SC, Lamb DJ, Hotaling JM, Giwercman A, Hwang K, Cheng YS. Male infertility. Nat Rev Dis Primers. 2023;9:49. doi: 10.1038/s41572-023-00459-w. - DOI - PubMed

Substances