. 2025 Aug;16(4):e70001.
doi: 10.1002/jcsm.70001.

Impaired Autophagic Flux in Skeletal Muscle of Plectin-Related Epidermolysis Bullosa Simplex With Muscular Dystrophy

Affiliations

Impaired Autophagic Flux in Skeletal Muscle of Plectin-Related Epidermolysis Bullosa Simplex With Muscular Dystrophy

Michaela M Zrelski et al. J Cachexia Sarcopenia Muscle. 2025 Aug.

Abstract

Background: Plectin, a multifunctional cytolinker and intermediate filament stabilizing protein, is essential for muscle fibre integrity and function. Mutations in the human plectin gene (PLEC) cause autosomal recessive epidermolysis bullosa simplex with muscular dystrophy (EBS-MD). The disorganization and aggregation of desmin filaments in conjunction with degenerative changes of the myofibrillar apparatus are key features in the skeletal muscle pathology of EBS-MD. We performed a comprehensive analysis addressing protein homeostasis in this rare protein aggregation disease by using human EBS-MD tissue, plectin knock-out mice and plectin-deficient cells.

Methods: Protein degradation pathways were analysed in muscles from EBS-MD patients, muscle-specific conditional plectin knockout (MCK-Cre/cKO) mice, as well as in plectin-deficient (Plec-/-) myoblasts by electron and immunofluorescence microscopy. To obtain a comprehensive picture of autophagic processes, we evaluated the transcriptional regulation and expression levels of autophagic markers in plectin-deficient muscles and myoblasts (RNA-Seq, qRT-PCR, immunoblotting). Autophagic turnover was dynamically assessed by measuring baseline autophagy as well as specific inhibition and activation in mCherry-EGFP-LC3B-expressing Plec+/+ and Plec-/- myoblasts, and by monitoring primary Plec+/+ and Plec-/- myoblasts using organelle-specific dyes. Wild-type and MCK-Cre/cKO mice were treated with chloroquine or metformin to assess the effects of autophagy inhibition and activation in vivo.

Results: Our study identified the accumulation of degradative vacuoles as well as LC3- and SQSTM1-positive patches in EBS-MD patients, MCK-Cre/cKO mouse muscles and Plec-/- myoblasts. The transcriptional regulation of ~30% of autophagy-related genes was altered, and protein levels of downstream targets of the autophagosomal degradation machinery were elevated in MCK-Cre/cKO muscle lysates (e.g., LAMP2, BAG3 and SQSTM1 to ~160, ~150 and ~140% of controls, respectively; p < 0.05). Autophagosome turnover was compromised in mCherry-EGFP-LC3B-expressing Plec-/- myoblasts (~40% reduction in median red:green ratio, reduced puncta number, smaller puncta; p < 0.01). By labelling autophagic compartments with CYTO-ID dye or lysosomes with LYSO-ID, we found reduced signal intensities in primary Plec-/- cells (p < 0.001). Treatment with chloroquine led to drastic swelling of autophagic vacuoles in primary Plec+/+ myoblasts, while the swelling in Plec-/- cells was moderate, establishing a defect in their autophagic clearance. Chloroquine treatment of MCK-Cre/cKO mice corroborated that loss of plectin coincides with impaired autophagic clearance, while metformin amelioratively induced autophagic flux.

Conclusions: Our work demonstrates that the characteristic protein aggregation pathology in EBS-MD is linked to an impaired autophagic flux. The obtained results open a new perspective on the understanding of the protein aggregation pathology in plectin-related disorders and provide a basis for further pharmacological intervention.

Keywords: autophagy; desmin; epidermolysis bullosa simplex with muscular dystrophy; myofibrillar myopathy; plectin; skeletal muscle.


Conflict of interest statement

The authors declare no conflicts of interest.

Figures
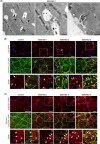
FIGURE 1
FIGURE 1
Identification of degradative vacuoles and accumulation of autophagy marker proteins in EBS‐MD patient muscle. (A) Representative electron micrographs of muscle sections derived from EBS‐MD patient 1 (EBS‐MD 1) displaying various degradative vacuoles (asterisks), partially filled with cytoplasmic material and/or membrane remnants and often associated with damaged mitochondria (arrowheads), as well as the occurrence of myelinated bodies (arrow). Scale bars: 500 nm. (B) Double immunostaining of frozen muscle sections derived from a healthy control (Control) and EBS‐MD patients (EBS‐MD 1, EBS‐MD 2, EBS‐MD 3) using antibodies to LC3 (red) and desmin (green). Nuclei were visualized using DAPI. Boxed areas indicate magnifications of individual muscle fibres (as denoted by the boxes I–VI). Note the accumulation of LC3‐positive patches within EBS‐MD patient myofibres, either colocalizing with desmin aggregates (arrows) or without desmin association (arrowheads). Also, note the occurrence of desmin‐positive protein aggregates not associating with LC3 protein signals (asterisks). Scale bars: 50 μm; magnifications I–VI 20 μm. (C) Double immunostaining of frozen muscle sections derived from a healthy control and EBS‐MD patients using antibodies to SQSTM1 (red) and desmin (green). Nuclei were visualized using DAPI. Boxed areas indicate magnifications of individual muscle fibres (as denoted by the boxes I–VI). Note the occurrence of individual EBS‐MD myofibres displaying massive SQSTM1‐positive areas, while others harbour small SQSTM1‐positive aggregates, either colocalizing with desmin aggregates (arrows) or without desmin association (arrowheads). Scale bars: 50 μm; magnifications I–VI 20 μm.
FIGURE 2
FIGURE 2
Accumulation of autophagy marker proteins and ultrastructural visualization of degradative vacuoles in plectin‐deficient mouse muscle. (A) Double immunostaining of cross and longitudinal soleus muscle sections from wild‐type and plectin‐deficient (MCK‐Cre/cKO) mice using antibodies to LC3 (red) and desmin (green). Nuclei were visualized with DAPI. Note the accumulation of LC3‐positive patches in plectin‐deficient muscles, either colocalizing with desmin aggregates (arrows) or without desmin association (arrowheads). Scale bars: 20 μm. (B) Double immunostaining of cross and longitudinal soleus muscle sections from wild‐type and MCK‐Cre/cKO animals using antibodies to SQSTM1 (red) and desmin (green). Nuclei were visualized with DAPI. Note the occurrence of individual plectin‐deficient myofibres displaying massive SQSTM1‐positive areas, while others harbour small SQSTM1‐positive aggregates, either colocalizing with desmin aggregates (arrows) or without desmin association (arrowheads). Scale bars: 20 μm. (C) Artificial intelligence (AI)‐based evaluation of SQSTM1 signal intensities within individual myofibres using MIRA Vision. Whole soleus muscle sections were scanned, myofibres automatically identified in an AI‐generated mask, and signal intensities obtained and binned for each genotype (bin size = 0.1). Histograms represent the frequency distribution of binned intensities obtained from two animals each (wild‐type, n = 673 fibres; MCK‐Cre/cKO, n = 1128 fibres). Note the expanded distribution of the histogram and a shift towards the right (i.e., higher intensities) for plectin‐deficient muscles. (D) Representative electron micrographs of soleus muscle cross sections obtained from 40‐week‐old MCK‐Cre/cKO mice. Note the occurrence of various degradative vacuoles, including vacuoles with their cargo engulfed in a double‐membrane (arrow), and pathologically enlarged vacuoles that are partially filled with glycogen and/or membrane remnants (asterisks). In addition, pathologically altered mitochondria with inclusions can be observed (arrowhead). Scale bars: 500 nm.
FIGURE 3
FIGURE 3
Increased protein levels of autophagic substrates in MCK‐Cre/cKO muscles. (A) RNA‐Seq analysis of mouse soleus muscle. Volcano plot illustrates differentially expressed genes in MCK‐Cre/cKO compared with wild‐type samples: significantly upregulated and downregulated genes are highlighted in red; the dotted line represents the cut‐off with p = 0.01. Genes from the Kyoto Encyclopedia of Genes and Genomes (KEGG) pathway ‘mmu04140 Autophagy ‐ animal’ are highlighted in blue and listed on the right. logFC, log fold change; n = 5 animals per genotype, sequenced individually. (B) Double immunostaining of soleus muscle sections from wild‐type and MCK‐Cre/cKO mice using antibodies to TFEB (red) and desmin (green). Nuclei were visualized with DAPI. Panels on the right are magnifications of boxed areas indicated in the panels on the left. Note that while a nuclear localization of TFEB was preserved in both genotypes (arrows), concentrated TFEB‐positive subsarcolemmal and intermyofibrillar areas occurred only in MCK‐Cre/cKO fibres. Also note that some desmin‐positive aggregates colocalized with TFEB‐positive signals (arrowheads), while others did not. Scale bars: 50 μm, magnifications 10 μm. Quantification of nuclei with or without TFEB localization (wild‐type, n = 1082 nuclei; MCK‐Cre/cKO, n = 1466 nuclei; two animals each). (C) Immunoblotting of wild‐type and MCK‐Cre/cKO muscle lysates using antibodies to ubiquitin and GAPDH. Signal intensities of immunoblots were densitometrically measured and normalized to the total protein content as analysed by Coomassie staining (not shown). Mean ± SEM; n = 8. (D) Chymotrypsin‐, trypsin‐, and caspase‐like proteasomal activities were measured in wild‐type and MCK‐Cre/cKO muscle lysates derived from 13‐week‐old mice. Mean ± SEM; samples were measured as triplicates, n = 3 animals each. (E) Immunoblotting of wild‐type and MCK‐Cre/cKO muscle lysates using antibodies to LAMP2, BAG3, total and two phosphorylated forms of SQSTM1 and GAPDH. Signal intensities of protein bands were densitometrically measured and normalized to the total protein content as analysed by Coomassie staining (not shown). Mean ± SEM; n = 7–8. (F) Immunoblotting of wild‐type and MCK‐Cre/cKO muscle lysates using antibodies to LC3 and GAPDH. Signal intensities of upper (nonlipidated, LC3‐I) and lower (lipidated, LC3‐II) protein bands were densitometrically measured and normalized to the total protein content (as analysed by Coomassie staining, not shown). From these values, the LC3‐II to LC3‐I ratios were calculated. Mean ± SEM; n = 10. For C–F: *p < 0.05, **p < 0.01, ***p < 0.001 (two‐tailed, unpaired t test with Welch's correction); ns, not significant.
FIGURE 4
FIGURE 4
Impaired autophagic flux in mCherry‐EGFP‐LC3B‐expressing plectin‐deficient myoblast cell lines. (A) Immortalized (p53 −/− ) plectin‐expressing (Plec +/+ ) and plectin‐deficient (Plec −/− ) myoblasts stably expressing mCherry‐EGFP‐LC3B at basal conditions. Panels on the right are single plane magnifications of the boxed areas indicated in the confocal images in the panels on the left. Note increased cytoplasmic LC3B signals Plec −/− myoblasts. Scale bars: 20 μm, magnifications 10 μm. Red:green signal ratios of mCherry‐EGFP‐LC3B‐expressing Plec +/+ and Plec −/− myoblasts at basal conditions: box plots show the median and Tukey whiskers (Plec +/+ , n = 468 cells; Plec −/− , n = 455 cells); ***p < 0.001 (two‐tailed Mann–Whitney test). Number of mCherry‐positive puncta per cell was determined by using the 3D Objects Counter; each dot represents a single field‐of‐view, the line represents the mean (Plec +/+ , n = 13 field‐of‐views; Plec −/− , n = 14 field‐of‐views); **p < 0.01 (two‐tailed, unpaired t test with Welch's correction). Volume of mCherry‐positive puncta was determined by using the 3D Objects Counter; violin plots show median, the 25th and 75th percentile (Plec +/+ , n = 38 926 puncta [468 cells]; Plec −/− , n = 29 302 puncta [455 cells]); ***p < 0.001 (two‐tailed Mann–Whitney test). (B) mCherry‐EGFP‐LC3B‐expressing Plec +/+ and Plec −/− myoblasts were treated with 9‐mM 3‐methyladenine (3‐MA) or 50‐μM chloroquine (CQ) for 3 h. Control cells (ctrl) were either kept in DMEM‐based growth medium containing 10% FCS (3‐MA treatment) or in F‐10‐based growth medium containing 20% FCS (CQ treatment), as described in the Supporting Information. Panels on the right are single plane magnifications of the boxed areas indicated in the confocal images in the centre panels. Note the increased cytoplasmic LC3B signals upon 3‐MA treatment, and the massive swelling of vesicles upon CQ treatment in Plec +/+ myoblasts, while Plec −/− myoblasts remained largely unaltered. Also note the occurrence of partially acidified autolysosomes in CQ‐treated Plec +/+ myoblasts, as denoted by the formation of green ring‐like structures. Scale bars: 20 μm, magnifications 5 μm. Red:green signal ratios of ctrl‐, 3‐MA‐ and CQ‐treated mCherry‐EGFP‐LC3B‐expressing Plec +/+ and Plec −/− myoblasts: box plots show the median and Tukey whiskers (Plec +/+ , n = 103/113 [control/3‐MA] and 202/260 [control/CQ] cells; Plec −/− , n = 89/81 [control/3‐MA] and 142/206 [control/CQ] cells); *p < 0.05, **p < 0.01, ***p < 0.001 (two‐way ANOVA of the ranked dataset with Tukey's post hoc correction for multiple comparisons); ns, not significant. (C) mCherry‐EGFP‐LC3B‐expressing Plec +/+ and Plec −/− myoblasts were starved for 24 h or treated with 100‐mM metformin (Metf) for 48 h. Ctrl cells were either kept in DMEM‐based growth medium containing 10% FCS (starvation) or in F‐10‐based growth medium containing 20% FCS (Metf treatment). Panels on the right are single plane magnifications of the boxed areas indicated in the confocal images in the centre panels. Note the increased red signals in both cell lines compared with control conditions. Scale bars: 20 μm, magnifications 10 μm. Red:green signal ratios of ctrl‐, starved or Metf‐treated mCherry‐EGFP‐LC3B‐expressing Plec +/+ and Plec −/− myoblasts: box plots show the median and Tukey whiskers (Plec +/+ , n = 185/177 [control/starved] and 500/460 [control/Metf] cells; Plec −/− , n = 176/177 [control/starved] and 630/285 [control/Metf] cells). ***p < 0.001 (two‐way ANOVA of the ranked dataset with Tukey's post hoc correction for multiple comparisons).
FIGURE 5
FIGURE 5
Impaired autophagic flux, reduced lysosomal capacities and reduced intracellular cathepsin B protease activity in Plec −/− myoblasts. (A) Flow cytometry of CYTO‐ID‐stained Plec +/+ and Plec −/− myoblasts at control conditions or treated with 50‐μM CQ for 3 h and calculation of the increase in median fluorescence intensity (MFI) upon CQ treatment (CQ:control). Line shows the mean, n = 3 experiments (7.5 × 104–9.5 × 104 cells/experiment); RLU, relative light units. (B) Flow cytometry of LYSO‐ID‐stained Plec +/+ and Plec −/− myoblasts at control conditions or treated with 50‐μM CQ for 3‐h calculation of the increase MFI upon CQ treatment (CQ:control). Line shows the mean; n = 3 experiments (4.1 × 104–9.4 × 104 cells/experiment). (C) Plec +/+ and Plec −/− myoblasts were stained with the Magic Red Cathepsin B Assay Kit. Nuclei were visualized with Hoechst. Scale bars: 20 μm. Magic Red signal intensities were calculated by normalizing the RawIntDens of a field‐of‐view to the number of cells. Each dot represents a single field‐of‐view, the line represents the mean (Plec +/+ , n = 9 [723 cells]; Plec −/− , n = 9 [748 cells] field‐of‐views). For A–C: *p < 0.05, **p < 0.01, ***p < 0.001 (two‐tailed, unpaired t test with Welch's correction); ns, not significant.
FIGURE 6
FIGURE 6
Impaired autophagic flux and reduced capacities of acidic compartments in primary plectin‐deficient myoblasts. (A) Primary murine plectin‐expressing myoblasts (Plec +/+ ) or plectin‐deficient (Plec −/− ) myoblasts were stained with CYTO‐ID at control conditions. Nuclei were visualized with Hoechst. Panels on the right are magnifications of the boxed areas indicated in the panels on the left. Scale bars: 20 μm, magnifications 5 μm. CYTO‐ID signal intensities in Plec +/+ and Plec −/− myoblasts at control conditions were calculated by normalizing the RawIntDens to cell areas. Box plots show the median and Tukey whiskers (Plec +/+ , n = 177 cells; Plec −/− , n = 145 cells). Number of CYTO‐ID‐positive puncta per cell was determined by using the 3D Objects Counter. Each dot represents a single field‐of‐view, the line represents the mean (Plec +/+ , n = 10 field‐of‐views; Plec −/− , n = 14 field‐of‐views). Volume of CYTO‐ID‐positive puncta was determined by using the 3D Objects Counter. Violin plots show median, the 25th and 75th percentile (Plec +/+ , n = 7005 puncta [177 cells]; Plec −/− , n = 4474 puncta [145 cells]). (B) Primary Plec +/+ and Plec −/− myoblasts were treated with 50‐μM CQ for 3 h and stained with CYTO‐ID. Nuclei were visualized with Hoechst. Panels on the right are magnifications of the boxed areas indicated in the panels on the left. Note the massively swollen vesicles in CQ‐treated Plec +/+ myoblasts, while CQ treatment of Plec −/− myoblasts caused marginal vesicle swelling. Scale bars: 20 μm, 5‐μm magnifications. CYTO‐ID signal intensities in CQ‐treated Plec +/+ and Plec −/− myoblasts were calculated by normalizing the RawIntDens to cell areas. Box plots show the median and Tukey whiskers (Plec +/+ , n = 187 cells; Plec −/− , n = 172 cells). (C) Primary Plec +/+ and Plec −/− myoblasts were stained with LYSO‐ID at control conditions. Nuclei were visualized with Hoechst. Panels on the right are magnifications of the boxed areas indicated in the panels on the left. Scale bars: 20 μm, magnifications 5 μm. LYSO‐ID signal intensities in Plec +/+ and Plec −/− myoblasts at control conditions were calculated by normalizing the RawIntDens to cell areas. Box plots show the median and Tukey whiskers (Plec +/+ , n = 166 cells; Plec −/− , n = 155 cells). Number of LYSO‐ID‐positive puncta per cell was determined by using the 3D Objects Counter. Each dot represents a single field‐of‐view, the line represents the mean (Plec +/+ , n = 10 field‐of‐views; Plec −/− , n = 10 field‐of‐views). Volume of LYSO‐ID‐positive puncta was determined by using the 3D Objects Counter. Violin plots show median, the 25th and 75th percentile (Plec +/+ , n = 4574 puncta [166 cells]; Plec −/− , n = 2452 puncta [155 cells]). (D) Primary Plec +/+ and Plec −/− myoblasts were treated with 50‐μM CQ for 3 h and stained with LYSO‐ID. Nuclei were visualized with Hoechst. Panels on the right are magnifications of the boxed areas indicated in the panels on the left. Note the massively swollen vesicles in CQ‐treated Plec +/+ myoblasts, while CQ treatment of Plec −/− myoblasts caused marginal vesicle swelling. Scale bars: 20 μm, magnifications 5 μm. LYSO‐ID signal intensities in CQ‐treated Plec +/+ and Plec −/− were calculated by normalizing the RawIntDens to cell areas. Box plots show the median and Tukey whiskers (Plec +/+ , n = 246; Plec −/− , n = 186 cells). For A–D: *p < 0.05, ***p < 0.001 (two‐tailed Mann–Whitney test); ns, not significant.
FIGURE 7
FIGURE 7
Reduced autophagic capacities in EBS‐MD patient fibroblasts. (A) Immunostaining of primary human dermal fibroblasts obtained from healthy controls or EBS‐MD patients using antibodies to LC3 or SQSMT1. Nuclei were visualized with DAPI. Scale bars: 20 μm. (B) SQSTM1 signal intensities in control and EBS‐MD fibroblasts were calculated by normalizing the RawIntDens to cell areas. Each dot represents a single cell, the line represents the median (control 2, n = 78 cells; control 3, n = 73 cells; EBS‐MD 4, n = 82 cells; EBS‐MD 5, n = 88 cells); **p < 0.01 (Kruskal–Wallis test with Dunn's correction for multiple comparisons). (C) Flow cytometry of CYTO‐ID‐stained control and EBS‐MD fibroblasts at control conditions or treated with 50‐μM CQ for 3 h and calculation of the increase in MFI upon treatment with CQ (CQ:control). Each dot represents the MFI (control 2, n = 8.3 × 104/8.5 × 104 [control/CQ treated] cells; control 3, n = 7.8 × 104/6.8 × 104 [control/CQ treated] cells; EBS‐MD 1, n = 8.2 × 104/7.2 × 104 [control/CQ treated] cells; EBS‐MD 2, n = 7.5 × 104/4.4 × 104 [control/CQ treated] cells).
FIGURE 8
FIGURE 8
Metformin treatment of wild‐type and MCK‐Cre/cKO mice. (A) Immunostaining using antibodies to SQSTM1 of frozen muscle sections prepared from wild‐type and MCK‐Cre/cKO mice treated for 30 days with sweetened water with or without 500 mg/kg/day Metf. Nuclei were visualized with DAPI. Panels on the right are magnifications of the boxed areas indicated in the panels on the left. Note enhanced SQSTM1 signals in wild‐type muscles upon Metf‐treatment, whereas the SQSTM1 signals in MCK‐Cre/cKO muscles remain similar to control (Ctrl)‐treated samples. Scale bars: 20 μm, magnifications 10 μm. (B) Immunoblotting of Ctrl‐ or Metf‐treated wild‐type and MCK‐Cre/cKO muscle lysates using antibodies to BAG3, total and phosphorylated forms of SQSTM1, LC3, and GAPDH. (C) Signal intensities of protein bands as shown in (B) were densitometrically measured and normalized to the total protein content as analysed by Coomassie staining (not shown). Mean ± SEM; n = 3–5; all p values are indicated (unpaired, two‐tailed t test with Welch's correction). (D) Representative electron micrographs of soleus muscle cross sections obtained from Ctrl‐ or Metf‐treated wild‐type and MCK‐Cre/cKO mice. Note the occurrence of mitochondrial abnormalities and degradative vacuoles (arrowheads) in Ctrl‐treated MCK‐Cre/cKO muscles; no aggravation of autophagolytic changes was observed upon Metf‐treatment. Scale bars: 500 nm. (E) Soleus muscle sections from Ctrl‐ or Metf‐treated wild‐type and MCK‐Cre/cKO mice were stained with acid phosphatase (AP) and subjected to AI‐based evaluation of AP signal intensities within individual myofibres using MIRA Vision. Scale bars: 25 μm. Note the increased AP staining (red) within Metf‐treated wild‐type, as well as Ctrl‐ and Metf‐treated MCK‐Cre/cKO myofibres. Also note the switch in mean fibre intensity distribution in MCK‐Cre/cKO muscles from a normal distribution (Ctrl‐treated) to bimodal (Metf‐treated). Wild‐type, n = 1491/1295 fibres [Ctrl/Metf]; MCK‐Cre/cKO, n = 1456/1287 fibres [Ctrl/Metf]; two animals each; ***p < 0.001 (two‐way ANOVA of the ranked dataset with Tukey's post hoc correction for multiple comparisons); ns, not significant.

Similar articles

References

    1. Agnetti G., Herrmann H., and Cohen S., “New Roles for Desmin in the Maintenance of Muscle Homeostasis,” FEBS Journal 289 (2022): 2755–2770. - PubMed
    1. Wiche G., “Plectin‐Mediated Intermediate Filament Functions: Why Isoforms Matter,” Cells 10 (2021): 2154. - PMC - PubMed
    1. Rezniczek G. A., Abrahamsberg C., Fuchs P., Spazierer D., and Wiche G., “Plectin 5′‐Transcript Diversity: Short Alternative Sequences Determine Stability of Gene Products, Initiation of Translation and Subcellular Localization of Isoforms,” Human Molecular Genetics 12 (2003): 3181–3194. - PubMed
    1. Rezniczek G. A., Konieczny P., Nikolic B., et al., “Plectin 1f Scaffolding at the Sarcolemma of Dystrophic (mdx) Muscle Fibers Through Multiple Interactions With β‐Dystroglycan,” Journal of Cell Biology 176 (2007): 965–977. - PMC - PubMed
    1. Konieczny P., Fuchs P., Reipert S., et al., “Myofiber Integrity Depends on Desmin Network Targeting to Z‐Disks and Costameres via Distinct Plectin Isoforms,” Journal of Cell Biology 181 (2008): 667–681. - PMC - PubMed