. 2025 Dec;57(1):2529577.
doi: 10.1080/07853890.2025.2529577. Epub 2025 Jul 11.

Experimental study on the role and biomarker potential of CX3CR1 in osteoarthritis

Affiliations

Experimental study on the role and biomarker potential of CX3CR1 in osteoarthritis

Junpu Huang et al. Ann Med. 2025 Dec.

Abstract

Background: Osteoarthritis (OA) is a chronic joint disorder marked by progressive degeneration of articular cartilage and the formation of secondary osteophytes. Despite extensive research, the underlying molecular mechanisms remain poorly understood. This study aimed to identify OA-associated genes and elucidate the molecular pathways implicated, with the goal of discovering reliable diagnostic biomarkers.

Methods: The microarray dataset was retrieved from the Gene Expression Omnibus (GEO) and analyzed using R software to identify the signature gene, CX3CR1. Differentially expressed genes (DEGs) correlated with CX3CR1 were subsequently subjected to Gene Ontology (GO), Kyoto Encyclopedia of Genes and Genomes (KEGG), and immune infiltration analyses. A ceRNA regulatory network was also constructed. Vali-dation of CX3CR1 expression was conducted through qRT-PCR, Western blotting, and immunohistochemistry.

Results: CX3CR1 emerged as a candidate gene significantly associated with OA, exhibiting regulatory roles primarily in lipid metabolism-related and extra-cellular matrix-related biological processes and signaling cascades. The infiltration levels of immune cells, particularly activated mast cells, appeared to modulate OA progression. Both in vitro and in vivo experiments demonstrated elevated CX3CR1 expression in OA tissues relative to controls, with a robust positive correlation observed between CX3CR1 and MMP13 levels.

Conclusion: CX3CR1 represents a potential biomarker for OA diagnosis and therapeutic targeting, exerting its effects by modulating lipid metabolism, extracellular matrix dynamics, and immune cell infiltration.

Keywords: Bioinformatic; CX3CR1; experiment; extracellular matrix; lipid metabolism; osteoarthritis; signature gene.


Conflict of interest statement

No commercial or financial relationships were identified during the study that could be interpreted as a potential conflict of interest.

Figures
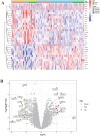
Figure 1.
Figure 1.
Identification of DEGs. A: Heatmap illustrating DEGs derived from the differential analysis of datasets GSE12021, GSE29746, GSE51588, and GSE55457, with samples categorized into control and treatment groups. Red indicates high ex-pression levels; blue denotes low expression. B: Volcano plot depicting DEG distribution. Red marks upregulated genes, green indicates downregulated genes, and grey represents non-significant differences.
Figure 2.
Figure 2.
Identification of signature gene. A: SVM analysis identified 14 genes corresponding to the highest classification accuracy (0.904). B: SVM analysis also revealed 14 genes at the point of lowest cross-validation error (0.0962). C: LASSO regression, optimized via the minimum log (lambda) criterion, selected 15 genes. D: Random Forest analysis yielded 8 genes ranked by importance scores (x axis) relative to gene names (y axis). E: Venn diagram summarizing the intersection of candidate genes obtained from LASSO, SVM, and RF analyses, highlighting the final signature genes.
Figure 3.
Figure 3.
Accuracy analysis of signature gene. A: Violin plot demonstrating CX3CR1 expression levels in control versus treatment groups within the experimental dataset; ROC curve indicates classification performance using CX3CR1 (AUC = 0.806). ***p < 0.001. B: Violin plot showing CX3CR1 expression in the validation dataset; ROC curve confirms discriminative capability of CX3CR1 (AUC = 1.000). **p < 0.01.
Figure 4.
Figure 4.
Signature gene correlation analysis. A: Heatmap depicting the expression profiles of genes in samples stratified by CX3CR1 expression levels, with red and green indicating high and low expression groups, respectively. Up-regulation is marked in red, and down-regulation in blue. B: Volcano plot illustrating CX3CR1-associated DEGs: up-regulated genes are colored red, down-regulated green, and non-significant genes gray. C: Bubble plot showing the correlation between CX3CR1 and 29 associated DEGs; red bubbles indicate positive correlations, blue indicate negative correlations.
Figure 5.
Figure 5.
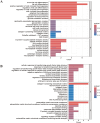
GO functional enrichment analysis. A: Bar of GO enrichment analysis of CX3CR1-associated up-regulated genes. B: Bar of GO enrichment analysis of CX3CR1-associated down-regulated genes.
Figure 6.
Figure 6.
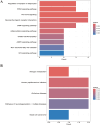
KEGG functional enrichment analysis. A: Bar of KEGG enrichment analysis of CX3CR1-associated up-regulated genes. B: Bar plot of KEGG enrichment analysis of CX3CR1-associated down-regulated genes.
Figure 7.
Figure 7.
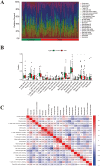
Immune cell infiltration analysis. A: Stacked bar graphs comparing the relative abundance of 22 immune cell types in treatment and control groups. B: Violin plots representing the distribution of 22 immune cell subsets across control and treatment samples. Statistical significance was assessed using the Wilcoxon test (*p < 0.05). C. Heatmap of intercellular correlation among the 22 immune cell types; positive correlations are shaded red, negative correlations blue, with color intensity reflecting correlation strength.
Figure 8.
Figure 8.
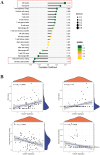
Immune correlation analysis. A: Lollipop plot depicting the correlation between CX3CR1 expression and immune cell subsets. Correlation coefficients >0 indicate positive associations; coefficients <0 indicate negative associations. Circle color reflects p value significance. B: Scatterplots based on Spearman’s rank correlation illustrating the relationship between CX3CR1 expression and the abundance of four selected immune cell types.
Figure 9.
Figure 9.
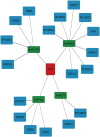
The ceRNA network analysis revealed that CX3CR1 competitively binds to 4 miRNAs, which are respectively associated with 17 lncRNAs, blue for lncRNA, green for miRNA, and red for mRNA.
Figure 10.
Figure 10.
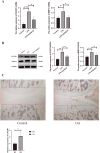
Analysis and validation of the signature gene CX3CR1. A: Quantitative analysis showing mRNA expression levels of CX3CR1 and MMP13 in chondrocytes from control, LPS group and LPS + AZD8797 group. (***p < 0.001, *p < 0.05). B: Western blot images representing CX3CR1 and MMP13 protein expression and GAPDH as an internal reference in control, LPS group and LPS+ AZD8797 group. (**p < 0.01, *p < 0.05). C: Immunohistochemical staining of CX3CR1 in articular cartilage sections from control and OA groups and quantitative analysis of positive cell staining in immunohistochemistry of CX3CR1. The results of the quantitative analysis were obtained from three independent experiments (*p < 0.05).

References

    1. Hunter DJ, Bierma-Zeinstra S.. Osteoarthritis. Lancet. 2019;393(10182):1745–1759. doi: 10.1016/S0140-6736(19)30417-9. - DOI - PubMed
    1. Safiri S, Kolahi A-A, Smith E, et al. Global, regional and national burden of osteoarthritis 1990–2017: a systematic analysis of the Global Burden of Disease Study 2017. Ann Rheum Dis. 2020;79(6):819–828. doi: 10.1136/annrheumdis-2019-216515. - DOI - PubMed
    1. Long H, Liu Q, Yin H, et al. Prevalence trends of site-specific osteoarthritis from 1990 to 2019: findings from the global burden of disease study 2019. Arthritis Rheumatol. 2022;74(7):1172–1183. doi: 10.1002/art.42089. - DOI - PMC - PubMed
    1. Reya T, Clevers H.. Wnt signalling in stem cells and cancer. Nature. 2005;434(7035):843–850. doi: 10.1038/nature03319. - DOI - PubMed
    1. Yao Q, Wu X, Tao C, et al. Osteoarthritis: pathogenic signaling pathways and therapeutic targets. Signal Transduct Target Ther. 2023;8(1):56. doi: 10.1038/s41392-023-01330-w. - DOI - PMC - PubMed