. 2025 Jul 24;129(29):7483-7498.
doi: 10.1021/acs.jpcb.5c02263. Epub 2025 Jul 11.

Using Deep Graph Neural Networks Improves Physics-Based Hydration Free Energy Predictions Even for Molecules Outside of the Training Set Distribution

Affiliations

Using Deep Graph Neural Networks Improves Physics-Based Hydration Free Energy Predictions Even for Molecules Outside of the Training Set Distribution

Luke H Elder et al. J Phys Chem B. .

Abstract

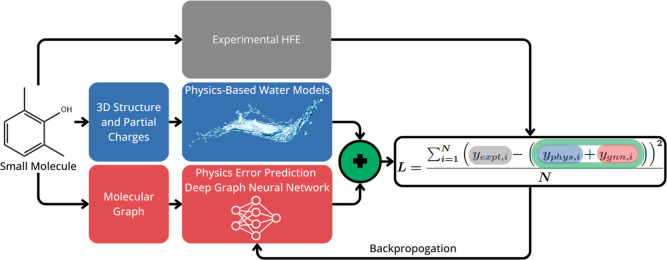
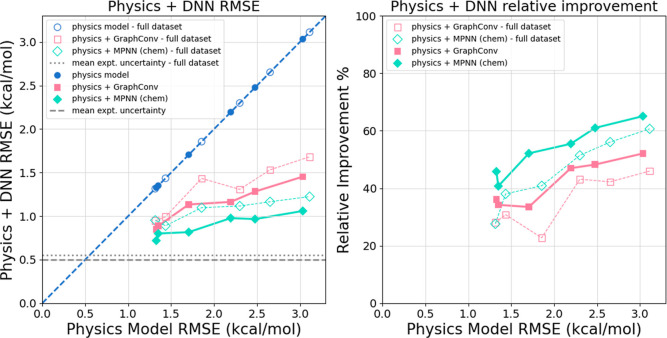
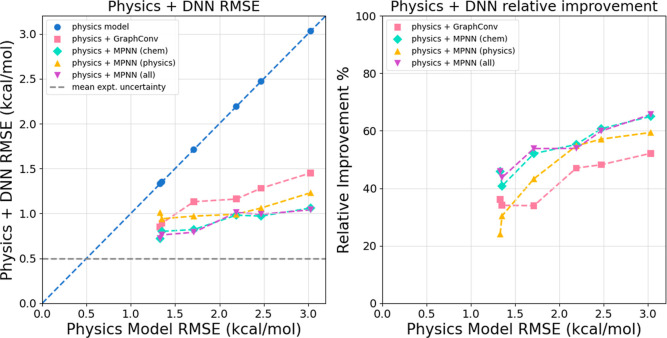
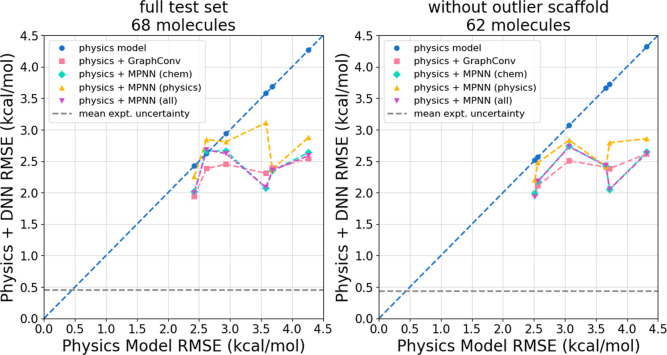
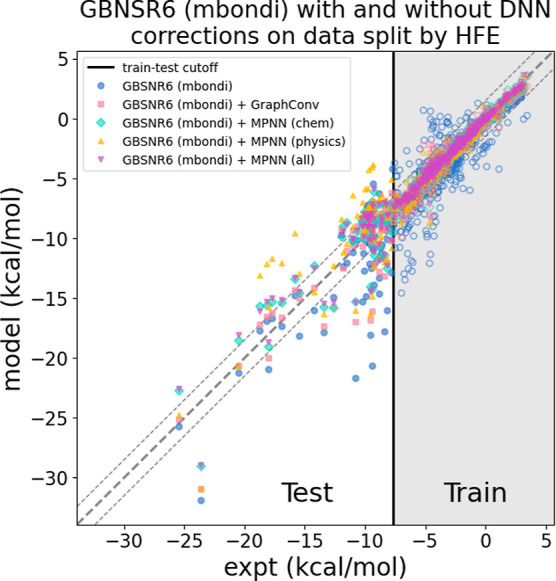
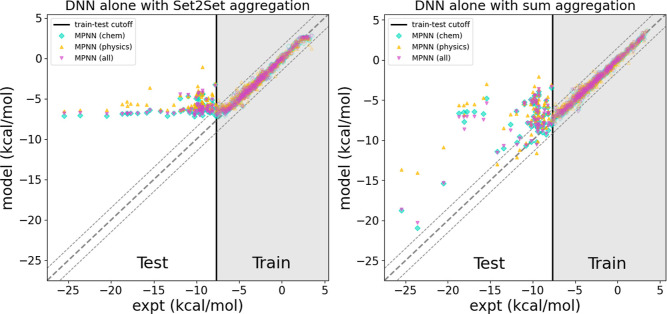
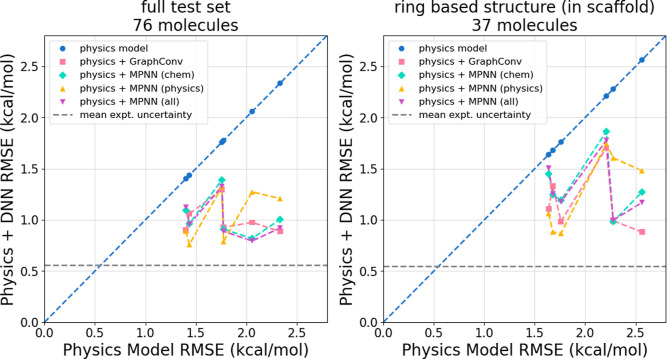
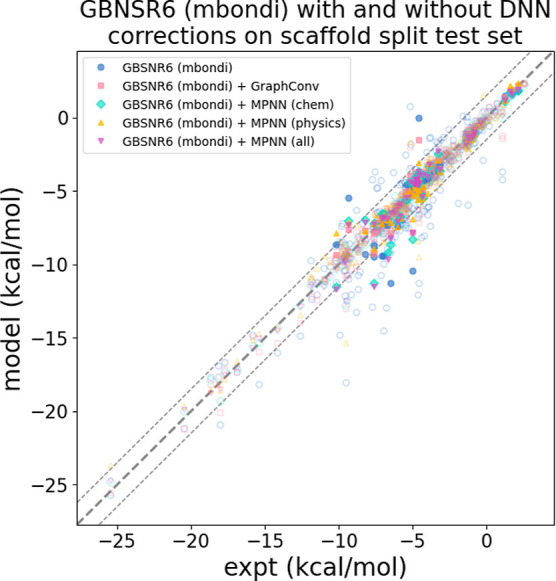
The accuracy of computational water models is crucial to atomistic simulations of biomolecules. Here we explore a decoupled framework that combines classical physics-based models with deep neural networks (DNNs) to correct residual error in hydration free energy (HFE) prediction. Our main goal is to evaluate this framework on out-of-distribution data (molecules that differ significantly from those used in training), where DNNs are known to struggle. Several common physics-based solvation models are used in the evaluation. Graph neural network architectures are tested for their ability to generalize using multiple data set splits, including out-of-distribution HFEs and unseen molecular scaffolds. Our most important finding is that for out-of-distribution data, where DNNs alone often struggle, the physics + DNN models consistently improve physics model predictions. For in-distribution data, the DNN corrections significantly improve the accuracy of physics-based models, with a final RMSE below 1 kcal/mol and a relative improvement between 40% and 65% in most cases. The accuracy of physics + DNN models tends to improve when the 6% of molecules with the highest experimental uncertainty are removed. This study provides insights into the potential and limitations of combining physics and machine learning for molecular modeling, offering a practical and generalizable strategy of using DNN as independent postprocessing correction.


Figures

1
1
Schematic showing our overall approach of using DNN to reduce the remaining error between the hydration energies predicted by physics-based models and experiment. The DNN is trained to minimize the remaining error of the “physics + DNN” prediction. The physics and the DNN parts of the overall workflow are completely separate and independent: the output of the physics-based model is only used in the loss for the DNN.
2
2
Physics + DNN models perform better when high uncertainty experimental values are excluded. (Left) Physics + DNN RMSE on the random stratified data split test set with and without filtering out high uncertainty experimental values plotted against physics model alone RMSE. The process for excluding uncertain experimental values is described in Section . Data points below the dashed blue line indicate that the physics + DNN model is more accurate than the physics model alone. In every case, the RMSE is lower when high uncertainty experimental values are excluded. (Right) Relative RMSE improvement for physics + DNN models on the random stratified data split test set with and without filtering out uncertain experimental values plotted against physics model alone RMSE. The relative improvement from DNN corrections is larger when high uncertainty experimental values are excluded.
3
3
All DNN models significantly improve performance of physics models on the random stratified data split test set. (Left) Physics + DNN RMSE plotted against physics model alone RMSE. This figure visualizes the data presented in Table . Data points below the dashed blue line indicate that the physics + DNN model is more accurate than the physics model alone. Each physics + DNN model performs significantly better than its corresponding physics model alone. As the physics model accuracy improves, the accuracy of each corresponding physics + DNN model also improves and RMSE begins to approach experimental uncertainty (dashed gray line). (Right) Relative RMSE improvement for physics + DNN models plotted against physics model alone RMSE. The relative improvement from DNN corrections decreases but remains significant as the physics model accuracy increases.
4
4
Use of DNN as a postprocessing correction improves the accuracy of the underlying physics model in almost all instances even for out of distribution HFEs. Shown are physics + DNN RMSE on the split by HFE test set plotted against physics model alone RMSE for each of the DNN models. (Left) Data for the entire test set of 68 molecules. This plot visualizes the data presented in Table . (Right) When excluding the 6 molecules in the O=c1cc­[nH]­c­(=O)­[nH]­1 scaffold, all DNN models improve the physics accuracy. Results for this outlier scaffold can be seen in the Supporting Information. Across both plots, data points below the dashed blue line indicate that the physics + DNN model is more accurate than the physics model alone. The least accurate physics models see significant improvement due to DNN corrections while the more accurate physics models see much smaller improvements.
5
5
DNN corrections improve physics-based predictions (GBNSR6, mbondi) on molecules with out-of-distribution HFE; the accuracy benefit of the correction diminishes for the most extreme HFE values. Data to the right of the vertical line (hollow data points) are those included in the training set while data to the left of the line (solid) are used as the test set. The thick dashed line indicates experiment while the thinner dashed lines show experiment ±1.5 kcal/mol. In most cases, physics predictions outside these lines (blue points) are “pushed” closer to the experimental reference by the DNN corrections.
6
6
DNN alone models struggle to perform well on molecules with out-of-distribution HFE. When this work’s default Set2Set node aggregation scheme is used (Left), the models are unable to generalize at all. When we use sum node aggregation (Right) the DNN predictions are more accurate, but still generalize poorly overall. Data to the right of the vertical line (hollow data points) are those included in the training set while data to the left of the line (solid) are used as the test set. The thick dashed line indicates experiment while the thinner dashed lines show experiment ±1.5 kcal/mol. Even for the sum node aggregation scheme, which is best suited for DNN alone approach (right panel) most DNN predictions are outside of these lines.
7
7
Physics + DNN RMSE on the scaffold split test set plotted against physics model alone RMSE for each of the DNN models. (Left) Data for the entire 76 molecule test set including molecules with no rings. This plot visualizes the data presented in Table . (Right) Data for the 37 molecules with ring based structures that are in a molecular scaffold. For both plots, data points below the dashed blue line indicate that the physics + DNN model is more accurate than the physics model alone. Even when predicting HFEs for molecules with unseen scaffolds, each physics + DNN model performs significantly better than its corresponding physics model alone.
8
8
DNN corrections improve predictions by physics-based model (GBNSR6, mbondi) on molecules with unseen molecular scaffolds. Hollow data points are the 215 molecules with molecular scaffolds included in the training set while the 37 molecules with unseen molecular scaffolds are shown as solid points. Note that molecules without a ring based structure (not in a scaffold) are not included in this figure. The thick dashed line indicates experiment while the thinner dashed lines show experiment ±1.5 kcal/mol. In most cases, physics predictions outside these lines (blue points) are pushed closer to experiment by the DNN corrections.

Similar articles

References

    1. Adcock S., McCammon J.. Molecular Dynamics: Survey of Methods for Simulating the Activity of Proteins. Chem. Rev. 2006;106:1589–1615. doi: 10.1021/cr040426m. - DOI - PMC - PubMed
    1. Karplus M., Kuriyan J.. Molecular dynamics and protein function. Proc. Natl. Acad. Sci. U.S.A. 2005;102:6679–6685. doi: 10.1073/pnas.0408930102. - DOI - PMC - PubMed
    1. Karplus M., McCammon J. A.. Molecular dynamics simulations of biomolecules. Nat. Struct. Biol. 2002;9:646–652. doi: 10.1038/nsb0902-646. - DOI - PubMed
    1. Raman E. P., MacKerell A. D.. Spatial Analysis and Quantification of the Thermodynamic Driving Forces in Protein-Ligand Binding: Binding Site Variability. J. Am. Chem. Soc. 2015;137:2608–2621. doi: 10.1021/ja512054f. - DOI - PMC - PubMed
    1. Jorgensen W. L.. The Many Roles of Computation in Drug Discovery. Science. 2004;303:1813–1818. doi: 10.1126/science.1096361. - DOI - PubMed

LinkOut - more resources