. 2025 Oct;12(37):e02249.
doi: 10.1002/advs.202502249. Epub 2025 Jul 11.

ATF3 Deficiency Exacerbates Ageing-Induced Atherosclerosis and Clinical Intervention Strategy

Affiliations

ATF3 Deficiency Exacerbates Ageing-Induced Atherosclerosis and Clinical Intervention Strategy

Hao Nie et al. Adv Sci (Weinh). 2025 Oct.

Abstract

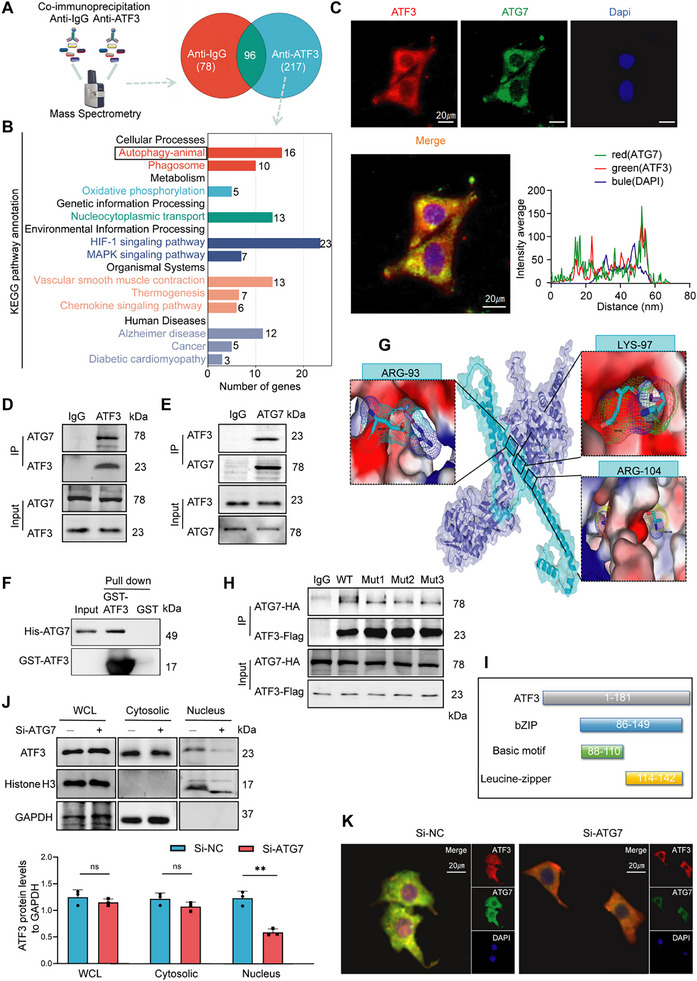
Vascular smooth muscle cell (VSMC) senescence is a pivotal driver of atherosclerosis (AS), but molecular links to ageing-related dysfunction are unclear. It is aimed to identify regulators of VSMC senescence and develop clinical interventions for ageing-related AS. Using single-cell RNA sequencing of human atherosclerotic carotid arteries and immunofluorescence validation, activating transcription factor 3 (ATF3) is identified as central to VSMC senescence. Mechanistic studies employ SMC-specific ATF3 knockout mice, CUT&Tag-seq, RNA/protein interaction assays, and m6A epitranscriptomic analyses. To bridge discovery to therapy, high-throughput virtual screening is performed for ATF3-targeting compounds and functionally validated hits. ATF3 deficiency in VSMCs accelerates ageing-induced AS by promoting senescence. Multi-omics showed ATF3 activates ATG7, triggering autophagy, while cytoplasmic ATG7 enhances ATF3 nuclear translocation, establishing a positive feedback loop. Ageing increases m6A methylation and decreases the stability of Atf3 mRNA. Terazosin (TZ) diminishes the interaction between YTH N6-methyladenosine RNA binding protein F2 (YTHDF2) and Atf3 mRNA, helping to preserve Atf3 mRNA stability. TZ is a promising therapeutic strategy for delaying VSMC senescence and preventing AS. ATF3 protects against VSMC senescence and AS by orchestrating autophagy via a novel ATF3-ATG7 amplification loop. Repurposing TZ to stabilize ATF3 offers a translatable approach to combat ageing-driven cardiovascular disease.

Keywords: activated transcription factor 3; atherosclerosis; autophagy; terazosin; vascular smooth muscle cells senescence.


Conflict of interest statement

The authors declare no conflict of interest.

Figures

Figure 1
Figure 1
Vascular smooth muscle cells (VSMCs) in atherosclerosis (AS) simultaneously display signs of senescence and a decline in ATF3 content. A) t‐SNE analysis of single cells from the carotid arteries of atherosclerosis patients, with 9 major cell types labeled in different colors. B) The violin plot illustrating the variation in levels of ATF3 across different cell types. C) IF imaging of ATF3 (red), α‐SMA (green), CD31(orange), and nuclei (blue) in human carotid arteries (scale bars = 20 µm; = 5). D) IF imaging of p53 (red), α‐SMA (green), and nuclei (blue) in human carotid arteries (scale bars = 20 µm; = 5). E) Feature plot illustrating the expression distribution of ATF3 and p53 in VSMCs. F) Scatter plot illustrating the correlation between p53 and ATF3 expression levels. G) Experimental design: SMC‐specific knockdown of ATF3 in SAMP8 mice (= 6). H) Pulse wave velocity (PWV) in SAMP8 mice (= 6). I) SA‐β‐gal staining of mouse aortas (scale bars = 5 mm, = 4). J) Western blot analysis of ATF3, p53, and p21 expression in SAMP8 mice aortas (= 5). K) Experimental design: SMC‐specific knockdown of ATF3 in ApoE‐/‐ mice. After 4 weeks, mice fed with high‐fat diet for 3 months (= 8). L) PWV in ApoE‐/‐ mice (= 6). M) SA‐β‐gal staining of mouse aortas (scale bars = 5 mm, n = 4). N) Western blot analysis of ATF3, p53, and p21 expression in ApoE‐/‐ mice aortas (= 5). O) Oil Red O staining and Hematoxylin and eosin staining of mouse aortas (scale bars = 100 µm, = 5). Error bars represent the mean ± standard deviation. The unpaired t‐test was used to compare data; *< 0.05, **< 0.01, ***< 0.001.
Figure 2
Figure 2
ATF3 facilitates autophagy through the upregulation of Atg7 transcription. A) The CUT&Tag calling peaks are enriched in the transcription start site (TSS) area by the heatmap. B) Clustering heatmap of differentially expressed genes between SAMP8+GFP∆SMC and SAMP8+shATF3∆SMC mice. C) Veen diagram of CUT&Tag and RNA‐seq intersecting targets. D) Dot plot of the GO pathway enrichment analysis of intersecting targets. E) Variations in the expression of genes enriched in the top three signaling pathways. F) ATF3 exhibits a significant binding peak in the promoter region of the Atg7 gene in CUT&Tag. And ChIP‐qPCR of ATF3 binding to the Atg7 promoter region. G) Luciferase assay of PGL3‐basic vector carrying wild‐type or mutant Atg7 3′‐UTR co‐transfected with ATF3 or negative control in HEK‐293 T cells (= 3). TK: pRL‐TK, Renilla Luciferase and Thymidine Kinase promoter. H,I) Immunofluorescent staining of ATF3 (red), ATG7 (green), α‐SMA (pink), and nuclei (blue) in mouse aortas (scale bars = 20 µm; = 5). J,K) Western blot analysis of ATF3, LC3B‐II/LC3B‐I, SQSTM1 and ATG7 expression in mouse aortas (= 5). L) TEM observation of autophagic phenomena in VSMCs in mouse aortas (= 5), arrows indicate autophagosomes or autolysosomes (scale bars, 1 µm and 500 nm). M) Fluorescence analysis of VSMCs transfected with the mCherry‐GFP‐LC3 reporter (= 3); red: autophagosomes, yellow: autolysosomes (scale bars, 10 µm). N) TEM observation of autophagic phenomena in VSMCs (n = 3), arrows indicate autophagosomes or autolysosomes (scale bars, 2 µm and 500 nm). Error bars represent the mean ± standard deviation. The unpaired t‐test (I,K), one‐way ANOVA (G), and Mann–Whitney U‐test (M) were used to compare data; *< 0.05, **p < 0.01, ***< 0.001.
Figure 3
Figure 3
ATG7 promotes the translocation of ATF3 into the nucleus. A,B) Pull‐down proteomics analysis of ATF3 and IgG antibodies: differential protein Venn diagram (A) and KEGG pathway classification analysis (B). C) Fluorescence analysis of the cellular distribution of ATF3 and ATG7 (scale bars = 100 µm). D) Immunoprecipitation of ATG7 from VSMCs using ATF3 and IgG antibodies, respectively. E) Immunoprecipitation of ATF3 from VSMCs using ATG7 and IgG antibodies, respectively. F) GST‐pull‐down of His‐ATG7 from HEK‐293T cells with a GST‐ATF3 fusion protein. G) Visualization of the interaction between ATF3 and ATG7; blue: ATF3, purple: ATG7. The spatial structure is presented through a cartoon, and the surface is presented as a combination pocket. H) Different protein complex components from WT, Mutant1‐ (ATF3–A93G), Mutant2‐ (ATF3–L97G), or Mutant3‐ (ATF3–A104G) transfected HEK‐293T cells immunoprecipitated using the Flag tag antibody. I) 2D structure diagram of ATF3. J) Western blot analysis of ATF3 expression in the nucleus and cytoplasm following transfection of VSMCs with Si‐NC or Si‐ATG7 (= 3). K) Fluorescence analysis of ATF3 distribution in the nucleus and cytoplasm (scale bars, 20 µm; = 3). Input: whole cell lysates, IP: immunoprecipitants, Mut: Mutant. Error bars represent the mean ± standard deviation. The Mann–Whitney U‐test was performed to compare data; **< 0.01.
Figure 4
Figure 4
Terazosin (TZ) improves age‐related phenotypes in SAMP8 mice via ATF3. A) qPCR analysis of Atf3 in SAMP8 mice carotid arteries (= 5). B) Senescence decreases the half‐life of Atf3 mRNA in VSMCs (= 3). C) Relative m6A methylation abundances of Atf3 mRNA at the 1627 site measured by the SELECT method in VSMCs (= 3). D) Experimental design: screening small molecular drugs targeting ATF3. E) Visualization of the interaction between Atf3 mRNA, YTHDF2, and TZ. blue: YTHDF2, yellow: Atf3 mRNA with m6A modifications (blue), red: TZ. F) Structural backbone RMSD variations from molecular dynamics simulations and MM‐PBSA‐derived binding free energy values. G) Carry out YTHDF2‐RNA immunoprecipitation (RIP) in TZ‐treated VSMCs, then use qPCR to evaluate Atf3 mRNA expression. Analyze the influence of TZ on YTHDF2's affinity for Atf3 mRNA (n = 3). H) TZ increases the half‐life of Atf3 mRNA in VSMCs (= 3). I) Experimental design: Administered TZ via gavage to SAMP8 mice for three months, with SAMR1 as the control group (TZ1: 20 µg kg−1, TZ2: 60 µg kg−1, TZ3: 180 µg kg−1; n = 6). J) PWV in SAMR1 mice and SAMP8 mice (= 6). K) SA‐β‐gal staining of mouse aortas (scale bars = 5 mm, = 5). L) Western blot analysis of ATF3, p53, and p21 expression in mouse aortas (= 5). Error bars represent mean ± standard deviation. The one‐way ANOVA (G, J, L) and unpaired t‐test (A–C) were used to compare data; *< 0.05, **< 0.01, ***< 0.001.
Figure 5
Figure 5
TZ reverses VSMC senescence and phenotype conversion. A) Analysis of cell viability in VSMCs treated with varying TZ concentrations for 48 h (= 3). B,C) SA‐β‐gal staining of VSMCs (scale bars = 50 µm; = 3). D) Western blot analysis of ATF3, p53, and p21 expression in VSMCs (= 3). E,F) Prior to adding TZ to the senescent VSMCs, pre‐treat with Phen (phenoxybenzamine) for 4 h, using DZ (Doxazosin) as a negative control. E) SA‐β‐gal staining of VSMCs (scale bars = 50 µm; = 3). F) Western blot analysis of ATF3, p53, and p21 expression in VSMCs (= 3). G–I) Western blot analysis of SM22α and OPN expression in VSMCs (= 3). J–L) Immunofluorescent staining of SM22α (red), OPN (red), and nuclei (blue) in VSMCs (scale bars = 20 µm; = 3). Error bars represent mean ± deviation. The Kruskal–Wallis test was performed for data comparison. *< 0.05, **< 0.01, ***< 0.001.
Figure 6
Figure 6
TZ improves VSMC senescence by promoting the autophagy signaling pathway via ATF3. A) Experimental design: SAMP8 mice were injected tail vein with adenoassociated virus. After 4 weeks, mice received TZ (60 µg kg−1) by oral gavage for 3 months (n = 6). B) PWV in SAMP8 mice (= 6). C–E) SA‐β‐gal staining, Hematoxylin and eosin staining, EVG staining, and TEM of mouse aortas (scale bars, 5 mm, 50 µm, 100 µm, 1 µm, and 500 nm). EF: elastic fiber, CF: collagen fiber; arrows indicate areas of collagen fiber disarray (= 5). F–H) Western blot analysis of p53 and p21 expression in mouse aortas (= 5). I–L) Western blot analysis of LC3B‐II/LC3B‐I, SQSTM1, and ATG7 expression in mouse aortas (= 5). M) TEM observation of autophagic phenomena in VSMCs in mouse aortas (= 5); arrows indicate autophagosomes or autolysosomes (scale bars, 1 µm and 500 nm). Error bars represent mean ± standard deviation. The one‐way ANOVA was performed to compare data; *< 0.05, **< 0.01, ***p < 0.001.
Figure 7
Figure 7
TZ improves age‐related phenotypes in ApoE‐/‐ mice. A) Immunofluorescent staining of LC3B (red) and nuclei (blue) in human carotid arteries (scale bars, 20 µm; = 5). B,C) Immunofluorescent staining of ATG7 (red), α‐SMA (green), and nuclei (blue) in human carotid arteries (scale bars, 20 µm; = 5). D) Experimental design: Administered TZ via gavage to in APOE‐/‐ mice fed with a High‐fat diet for three months (TZ: 60 µg kg−1, = 8–10). E) Western blot analysis of ATF3, p53, and p21 expression in mouse aortas (= 5). F) PWV in ApoE‐/‐ mice (= 8–10). G–I) SA‐β‐gal staining, Hematoxylin and eosin staining, Oil Red O staining, and TEM of mouse aortas (scale bars, 5 mm, 100 µm, 1 µm, and 500 nm). EF: elastic fiber, CF: collagen fiber; arrows indicate areas of collagen fiber disarray (n = 5). J,K) Western blot analysis of LC3B‐II/LC3B‐I, SQSTM1, and ATG7 expression in mouse aortas (= 5). Error bars represent mean ± standard deviation. The unpaired t‐test (A,B) and one‐way ANOVA (E,F,G,I,K) were performed to compare data; *p < 0.05, **< 0.01, ***< 0.001.

References

    1. Du S., Ling H., Guo Z., Cao Q., Song C., Pharmacol. Res. 2021, 165, 105278. - PubMed
    1. Wang J. C., Bennett M., Circ. Res. 2012, 111, 245. - PubMed
    1. Xiang Q., Tian F., Xu J., Du X., Zhang S., Liu L., Biol. Rev. Cambridge Philos. Soc. 2022, 97, 1844. - PMC - PubMed
    1. Boutouyrie P., Chowienczyk P., Humphrey J. D., Mitchell G. F., Circ. Res. 2021, 128, 864. - PubMed
    1. Ocak U., Özdal M. T., Brain Hemorrh. 2024, 5, 46.

Substances

LinkOut - more resources