. 2025 Apr 2;28(5):112302.
doi: 10.1016/j.isci.2025.112302. eCollection 2025 May 16.

Humanized mouse model reveals T cell ANXA2 as a potential therapeutic target in ischemic stroke

Affiliations

Humanized mouse model reveals T cell ANXA2 as a potential therapeutic target in ischemic stroke

Tianyuan Zhang et al. iScience. .

Abstract

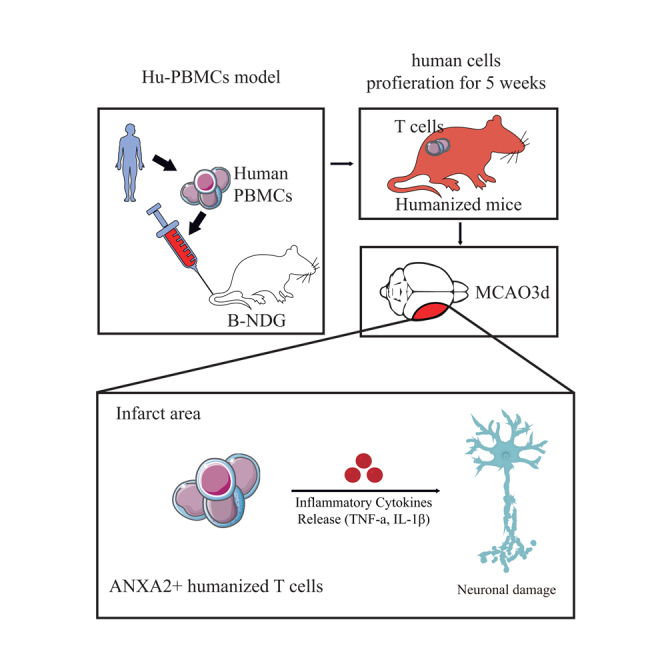
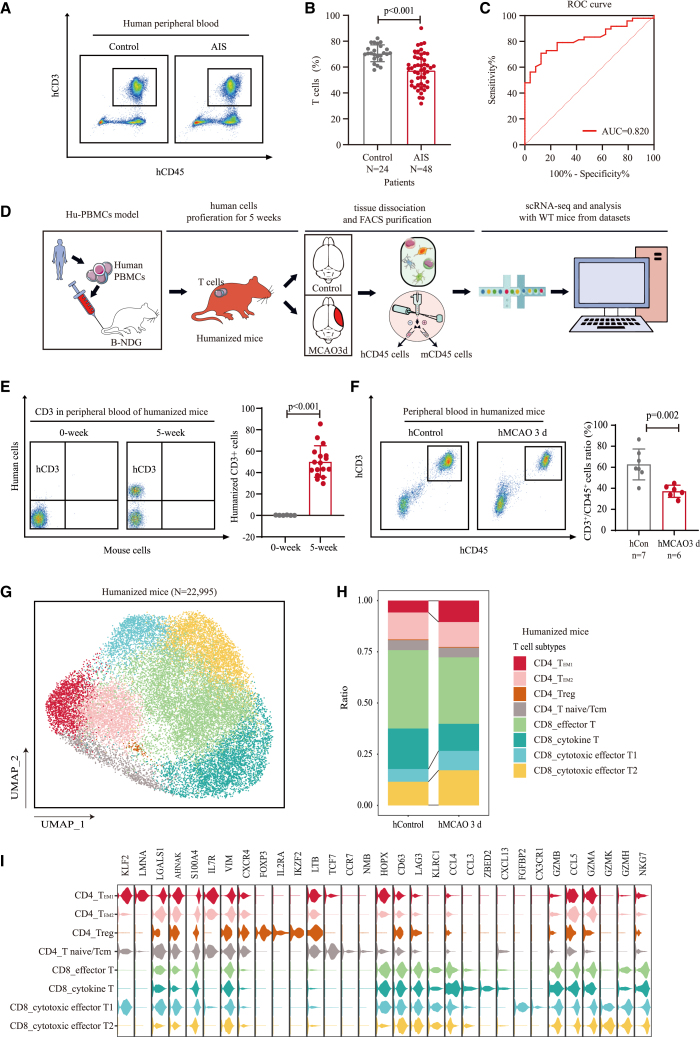
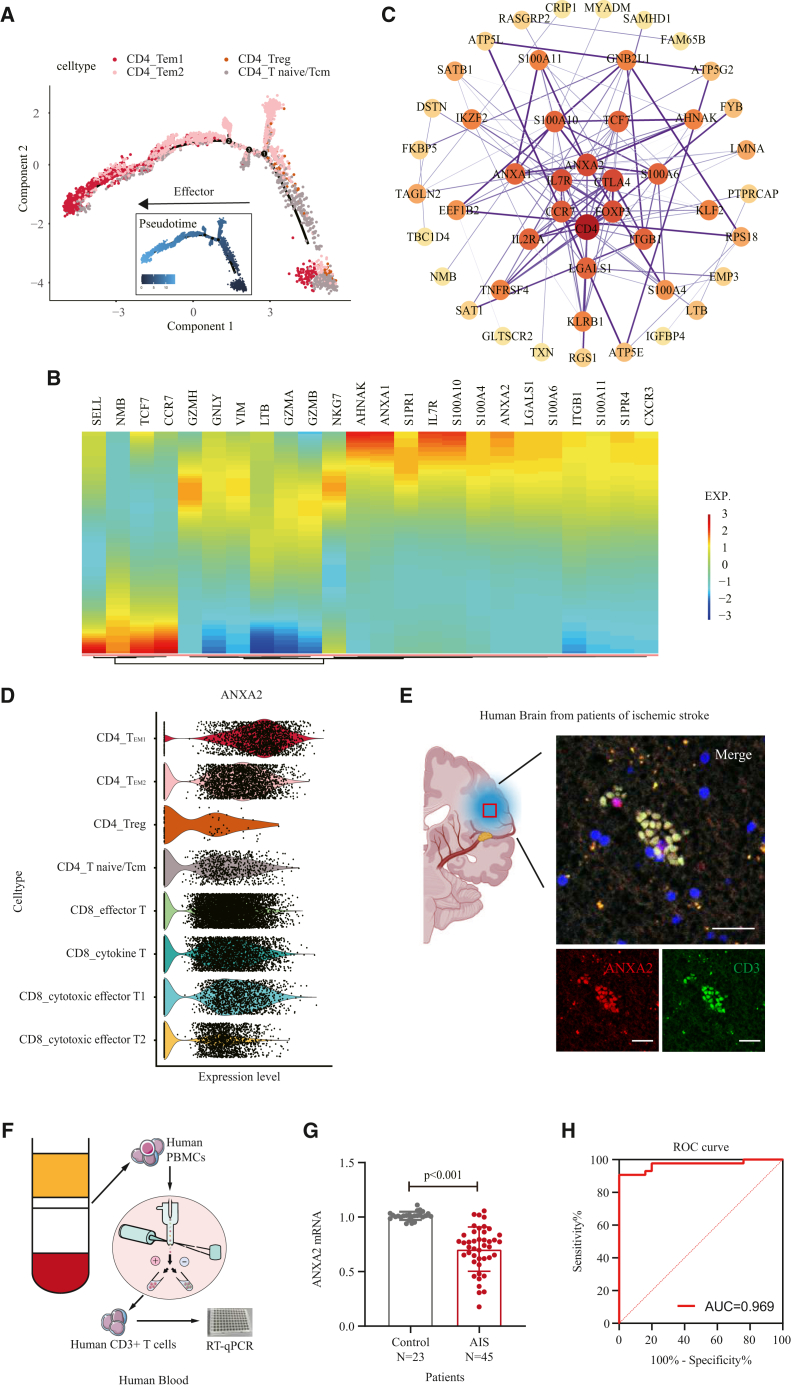
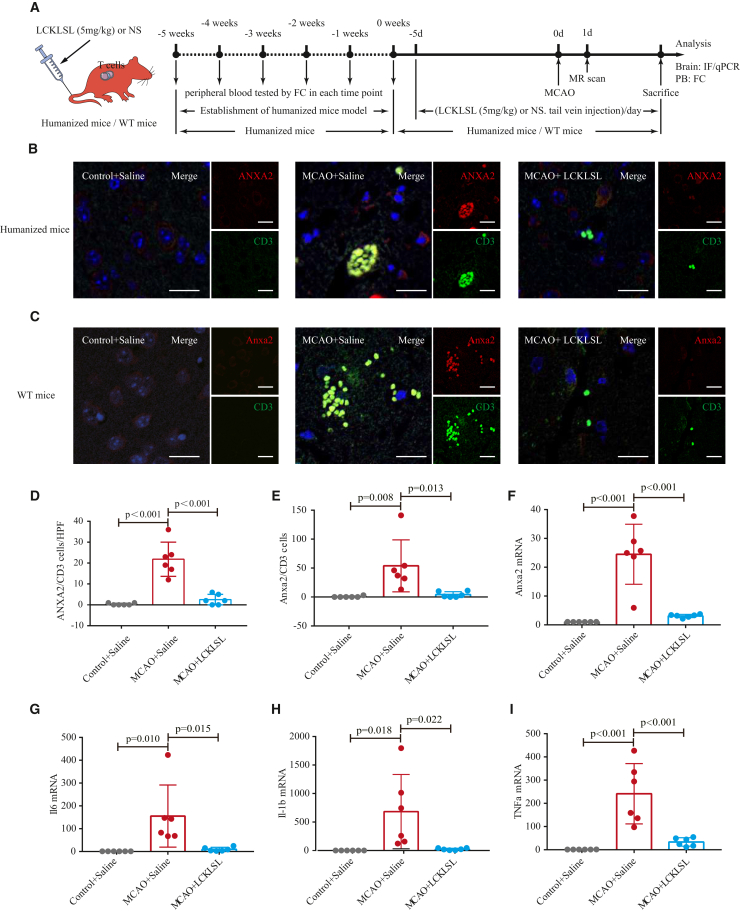
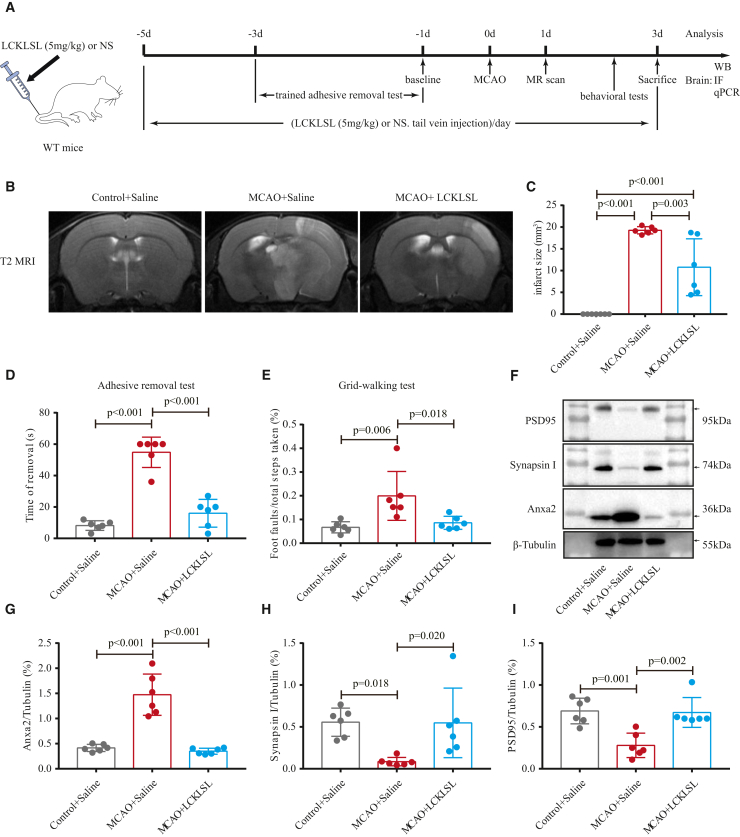
Stroke T cell studies in rodents have not been translated to human studies. The mechanism of cellular and molecular T cells changes after stroke remains incompletely understood. Thus, this study established a humanized mouse model after middle cerebral artery occlusion (MCAO) and identifies potential therapeutic targets of humanized T cell populations. Similar to patients with stroke, a proportion of T cells was decreased in peripheral blood of humanized T cell stroke mice. Using single-cell RNA sequencing (scRNA-seq), we identified Annexin A2 (ANXA2) as biomarker of humanized T cell subsets in MCAO, which was validated using human ischemic brain and peripheral blood. With small-molecule inhibitors Leu-Cys-Lys-Leu-Ser-Leu (LCKLSL), ANXA2 inhibition altered TCM and TEM subset in humanized mice. Furthermore, LCKLSL exhibited a neuroprotective role against ischemic damage, mitigating neuroinflammation, inhibiting T cell infiltration, and decreasing pro-inflammatory factors. Hence, this humanized T cell ischemic stroke model is more representative of the human disease than previous models; furthermore, ANXA2 is a meaningful therapeutic target.

Keywords: Model organism; Molecular neuroscience.


Conflict of interest statement

The authors declare no competing interests.

Figures

None
Graphical abstract
Figure 1
Figure 1
T cells were among the biomarkers and therapeutic targets in patients with stroke and the establishment of a humanized T cell ischemic stroke model mimicking the clinical scenario (A) Dot plots showing human T cells/immune cells (CD3+/CD45+) collected from the peripheral blood in patients with stroke and healthy controls (control). (B) Statistical analyses of T cells were performed using unpaired t tests. Data are presented as the mean ± standard deviation (SD). (C) Receiver operating characteristic (ROC) curve of T cells. (D) Experimental design for single-cell RNA sequencing (scRNA-seq) in humanized mice; single cells were collected from two replicates (eight mice in each replicate) for each group. (E) Dot plots and statistical analyses showing hCD3/mCD3 cells collected from the peripheral blood before the injection of human peripheral blood mononuclear cells (PBMCs) and 5 weeks after injection. (F) Scatterplots of flow cytometric analysis of T cells (CD3+/CD45+) in the blood of control and transient middle cerebral artery occlusion (tMCAO) 3D mice with humanized T cells. (G) Uniform manifold approximation and projection (UMAP) plot of eight humanized T cell subpopulations in mice with humanized T cells. Each dot corresponds to a single cell, and cells are colored according to cell type. (H) Proportion of each subtype of humanized T cells in humanized mice shown as a bar plot. (I) Violin plots of marker genes in each subtype of humanized T cells. Statistical analyses (E and F) were performed using unpaired t tests. Data are presented as the mean ± SD.
Figure 2
Figure 2
scRNA-seq revealed ANXA2 as the biomarker and therapeutic target of T cells, as verified in patients with ischemic stroke (A) Distribution of CD4+ T cell subpopulations on the pseudotime trajectory. Cells are colored according to T subtypes. (B) Heatmap showing pseudotime-dependent differential gene expression selected from CD4+ T cell subpopulations. (C) The genes selected from markers genes of CD4+ T cell subpopulations used for protein-protein interaction (PPI) networks. (D) Violin plot demonstrating the expression of ANXA2 in different T cell subpopulations in humanized mice. (E) Verification of the expression of ANXA2 and CD3 in the ischemic brain of a patient with stroke. Scale bar, 20 μm (F) The workflow of the detection of the ANXA2 mRNA experiment. (G) Comparison of ANXA2 mRNA between patients with acute ischemic stroke and controls in T cells sorted from PBMCs. Statistical analyses was performed using unpaired t tests. Data are presented as the mean ± SD. (H) ROC curve of ANXA2 mRNA.
Figure 3
Figure 3
ANXA2 was identified as a biomarker and therapeutic target, verified by humanized and WT stroke mouse models (A) The workflow of the impact of LCKLSL (an ANXA2 inhibitor) on T cells in humanized/wild-type (WT) mice. (B) The expression of ANXA2 and CD3 in the ischemic brain in the control, MCAO, and MCAO + LCKLSL groups; statistical analyses were performed with one-way ANOVA (D). Data are presented as the mean ± SD. Scale bar, 20 μm (C) The expression of Anxa2 and CD3 in the ischemic brain in the control, MCAO, and MCAO + LCKLSL groups; statistical analyses were performed with one-way ANOVA (E). Data are presented as the mean ± SD. Scale bar, 20 μm. Quantitative reverse transcription polymerase chain reaction (RT-qPCR) analysis of Anxa2 (F), Il-6 (G), Il-1b (H), and Tnfa (I) mRNA expression levels in the ischemic brain of control and tMCAO mice after tail injection of NS or LCKLSL on day 3. Data are presented as the mean ± SD; n = 6. Statistical significance was assessed with one-way ANOVA.
Figure 4
Figure 4
LCKLSL alleviated the cerebral infarction area and improved behavioral recovery (A) Experimental design for LCKLSL (ANXA2 inhibitor) treatment of ischemic stroke in vivo. (B) LCKLSL reduced the cerebral infarction area. The control, MCAO, and MCAO + LCKLSL groups were evaluated by magnetic resonance (MR) T2 Flair, and their statistical analysis is shown as a bar graph in (C). (D and E) Present the statistical analyses of the adhesive removal test and grid-walking test, which demonstrated that LCKLSL improved behavioral recovery. (F) The illustration of Anxa2 and synapsin protein levels (including presynaptic membrane protein, Synapsin I, and the postsynaptic membrane protein PSD95); statistical analyses are presented for Anxa2 (G), Synapsin I (H), and PSD95 (I). Data are presented as the means ± SD. n = 6 in each group.

Similar articles

References

    1. Owolabi M.O., Thrift A.G., Martins S., Johnson W., Pandian J., Abd-Allah F., Varghese C., Mahal A., Yaria J., Phan H.T., et al. The state of stroke services across the globe: Report of World Stroke Organization-World Health Organization surveys. Int. J. Stroke. 2021;16:889–901. doi: 10.1177/17474930211019568. - DOI - PMC - PubMed
    1. Iadecola C., Buckwalter M.S., Anrather J. Immune responses to stroke: mechanisms, modulation, and therapeutic potential. J. Clin. Investig. 2020;130:2777–2788. doi: 10.1172/JCI135530. - DOI - PMC - PubMed
    1. Chamorro Á., Meisel A., Planas A.M., Urra X., van de Beek D., Veltkamp R. The immunology of acute stroke. Nat. Rev. Neurol. 2012;8:401–410. doi: 10.1038/nrneurol.2012.98. - DOI - PubMed
    1. Shi K., Tian D.C., Li Z.G., Ducruet A.F., Lawton M.T., Shi F.D. Global brain inflammation in stroke. Lancet Neurol. 2019;18:1058–1066. doi: 10.1016/S1474-4422(19)30078-X. - DOI - PubMed
    1. Zhang Y., Liesz A., Li P. Coming to the Rescue: Regulatory T Cells for Promoting Recovery After Ischemic Stroke. Stroke. 2021;52:e837–e841. doi: 10.1161/STROKEAHA.121.036072. - DOI - PubMed

LinkOut - more resources