. 2025 Jun 25:16:1606437.
doi: 10.3389/fmicb.2025.1606437. eCollection 2025.

Effect of supplementation with L-Citrulline on rumen microbiota structure, plasma metabolites, reproductive hormones, and antioxidant capacity of Hu ewes

Affiliations

Effect of supplementation with L-Citrulline on rumen microbiota structure, plasma metabolites, reproductive hormones, and antioxidant capacity of Hu ewes

Renping Liu et al. Front Microbiol. .

Abstract

L-Citrulline (L-Cit), a non-essential amino acid, is characterized by its unique extrahepatic metabolism, which significantly enhances the bioavailability of arginine metabolism in tissues. This study investigated the impact of L-Cit supplementation on ruminal microbiota composition, plasma metabolites, reproductive hormones, and antioxidant capacity in Hu ewes. Sixty non-pregnant Hu ewes, similar in age and parity, with an average body weight of 47 ± 5.05 kg, were randomly assigned to either a Control group or Experimental group. The Control group received a basal diet, while the Experimental group was supplemented with 10 g/d of L-Cit in addition to the basal diet for 65 days. Compared to the Control group, the Experimental group exhibited a significantly higher estrus rate. Plasma estradiol (E2) levels were significantly reduced (p < 0.01), while luteinizing hormone (LH) and follicle-stimulating hormone (FSH) concentrations showed significant increases (p < 0.05). Testosterone (T) content was also significantly elevated (p < 0.01). Plasma levels of superoxide dismutase (SOD), malondialdehyde (MDA), glutathione peroxidase (GSH-PX), catalase (CAT), and total antioxidant capacity (T-AOC) were significantly higher in the experimental group, with highly significant differences (p < 0.01). The 16S rRNA sequencing analysis revealed that at the phylum level, the relative abundance of Bacteroidetes was decreased, while that of Firmicutes was increased in the experimental group. At the family level, the relative abundance of norank_o__Clostridia_UCG-014 was significantly increased. At the genus level, the relative abundance of Prevotellaceae_UCG-003 was significantly decreased. The main enriched pathways in the CON group were identified as Lipoic acid metabolism and Nicotinate and nicotinamide metabolism. The main enriched pathways in the experimental group were identified as Prion diseases, Chlorocyclohexane and chlorobenzene degradation, Chloroalkane and chloroalkene degradation, Biofilm formation-Escherichia coli, and Phosphotransferase system (PTS). LC-MS analysis indicated significant upregulation of pathways such as drug metabolism by other enzymes, folate biosynthesis, and valine, leucine, and isoleucine biosynthesis, whereas oxidative phosphorylation and propanoate metabolism were significantly downregulated. These results demonstrate that L-Cit supplementation in the diet modulates the ruminal microbiota of Hu ewes, optimizing volatile fatty acid (VFA) proportions, enhancing carbohydrate metabolism, improving xenobiotic degradation capacity, stimulating the synthesis and release of reproductive hormones. Ultimately, these coordinated effects led to a synergistic increase in estrus and conception rates.

Keywords: L-Citrulline; antioxidant capacity; reproductive hormones; rumen microbiota; untargeted metabolomics; volatile fatty acids.


Conflict of interest statement

ZL was employed by the Xinjiang Shangpin Meiyang Technology Co., Ltd. The remaining authors declare that the research was conducted in the absence of any commercial or financial relationships that could be construed as a potential conflict of interest.

Figures

Figure 1
Figure 1
The PCA plot was generated. C denotes the control group; T represents the experimental group.
Figure 2
Figure 2
The LefSe LDA bar plot was generated to display discriminative features. The LDA discriminant bar chart statistically represents microbial taxa with significant effects across multiple groups. The LDA score, obtained through LDA analysis (linear regression analysis), indicates that the higher the LDA score, the greater the impact of species abundance on the differential effect. C denotes the control group; T represents the experimental group.
Figure 3
Figure 3
Metabolic pathway differences diagram. C denotes the control group; T represents the experimental group.
Figure 4
Figure 4
(A) Principal Component Analysis (B) Bar Chart of Relative Abundance of Volatile Fatty Acids. (B) The bar chart represents the relative expression abundance of metabolites in each group. The horizontal axis denotes the different groups, while the vertical axis represents the mass spectrometry intensity values (preprocessed mass spectrometry intensity). The error bars indicate the mean ± standard deviation. Significant differences are marked with asterisks (*0.01 < p ≤ 0.05, **0.001 < p ≤ 0.01, ***p ≤ 0.001). (A,B) C denotes the control group; T represents the experimental group.
Figure 5
Figure 5
PLS-DA score chart. C denotes the control group; T represents the experimental group.
Figure 6
Figure 6
Volcanic diagram of differences in the merging of anions and cations. (A) Cation mode (B) Anion mode. The horizontal axis represents the fold change in metabolite expression between the two groups, i.e., log2FC, while the vertical axis represents the statistical test value of the difference in metabolite expression levels, i.e., −log10 (p_value). Higher values indicate more significant expression differences, and both axes are logarithmically transformed. Each point in the graph represents a specific metabolite, with the size of the point indicating the VIP value. By default, red points denote significantly upregulated metabolites, blue points denote significantly downregulated metabolites, and gray points represent non-significant differences. (A,B) C denotes the control group; T represents the experimental group.
Figure 7
Figure 7
(A) KEGG enrichment analysis bubble chart (B) KEGG pathway differential abundance score chart. (A,B) C denotes the control group; T represents the experimental group. (A) The horizontal axis represents the enrichment significance p-value; the smaller the p-value, the more statistically significant it is, with a p-value less than 0.05 generally considered as a significant enrichment item. The vertical axis represents the KEGG pathways. The size of the bubbles in the graph indicates the number of metabolites enriched in the metabolic set within that pathway. (B) In the graph, the horizontal axis represents the Differential Abundance Score (DA Score), while the vertical axis lists the names of the KEGG metabolic pathways. The DA Score reflects the overall changes in all metabolites within a metabolic pathway, with a score of 1 indicating an upward trend in the expression of all annotated differential metabolites in the pathway, and −1 indicating a downward trend. The length of the line segment represents the absolute value of the DA Score. The size of the dots indicates the number of annotated differential metabolites in the pathway, with larger dots representing a greater number of differential metabolites. Dots located to the right of the central axis with longer line segments suggest that the overall expression of the pathway tends to be upregulated; conversely, dots to the left of the central axis with longer line segments indicate a tendency towards downregulation in the pathway’s overall expression.
Figure 8
Figure 8
The effect of supplementing L-Cit on plasma reproductive hormones. Note: C denotes the control group; T represents the experimental group. (A): Estradiol; (B): Luteinizing hormone; (C): Follicle-stimulating hormone; (D): Gonadotropin-releasing hormone; (E): Testosterone.
Figure 9
Figure 9
The effect of supplementing L-Cit on plasma antioxidant capacity. (A) Superoxide Dismutase; (B) Malondialdehyde; (C) Glutathione Peroxidase; (D) Catalase; (E) Nitric Oxide; (F) Total Antioxidant Capacity. Note: C denotes the control group; T represents the experimental group.
Figure 10
Figure 10
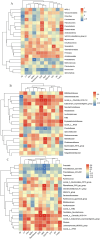
Correlation analysis of rumen microbiota with reproductive hormones and antioxidant markers across different levels. (A) Phylum level, (B) Family level, (C) Genus level. The X-axis and Y-axis represent environmental factors and species, respectively. The R-value and p-value are calculated. The R-value is displayed in different colors in the graph, and if the p-value is less than 0.05, it is marked with an asterisk (*). The legend on the right shows the color range for different R-values. *0.01 < p ≤ 0.05, **0.001 < p ≤ 0.01, ***p ≤ 0.001.
Figure 11
Figure 11
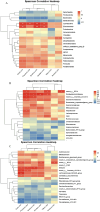
Correlation analysis of rumen microbiota and volatile fatty acids (VFAs) across different levels. (A) Phylum level, (B) Family level, (C) Genus level. The X-axis and Y-axis represent environmental factors and species, respectively. The R-value and p-value are calculated. The R-value is displayed in different colors in the graph, and if the p-value is less than 0.05, it is marked with an asterisk (*). The legend on the right shows the color range for different R-values. *0.01 < p ≤ 0.05, **0.001 < p ≤ 0.01, ***p ≤ 0.001.
Figure 12
Figure 12
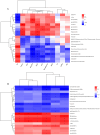
(A) Correlation network: plasma metabolites vs. reproductive hormones and antioxidant markers. (B) Correlation analysis plot of plasma differential metabolites and volatile fatty acids. The right side of the graph displays the names of metabolites, while the bottom lists the names of associated data. Each cell in the graph represents the correlation between two attributes (metabolites and associated features), with different colors indicating the magnitude of the correlation coefficient between the attributes. Asterisks denote the significance level of the p-value: *0.01 < p ≤ 0.05, **0.001 < p ≤ 0.01, ***p ≤ 0.001.
Figure 13
Figure 13
Synthesis figure of conclusions.

Similar articles

Cited by

References

    1. Alnakip M. E., Quintela-Baluja M., Böhme K., Fernández-No I., Caamaño-Antelo S., Calo-Mata P., et al. (2014). The immunology of mammary gland of dairy ruminants between healthy and inflammatory conditions. J. Vet. Med.:659801. doi: 10.1155/2014/659801 - DOI - PMC - PubMed
    1. An M. (2022). Effects of dietary L-citrulline supplementation on reproductive performance, lactation performance, and lamb growth in Hu ewes, thesis, Xinjiang Agricultural University, Urumqi
    1. Calabrò S. (2015). “Plant secondary metabolites” in Rumen microbiology: From evolution to revolution. eds. Puniya A., Singh R., Kamra D. (New Delhi: Springer; ), 153–159.
    1. Curis E., Nicolis I., Moinard C., Osowska S., Zerrouk N. I. M., Bénazeth S., et al. (2005). Almost all about citrulline in mammals. Amino Acids 29, 177–205. doi: 10.1007/s00726-005-0235-4, PMID: - DOI - PubMed
    1. Cynober L., Le Boucher J., Vasson M. P. (1995). Arginine metabolism in mammals. J. Nutr. Biochem. 6, 402–413. doi: 10.1016/0955-2863(95)00066-9 - DOI

LinkOut - more resources