. 2025 Jun 26:16:1636149.
doi: 10.3389/fphar.2025.1636149. eCollection 2025.

Molecular mechanisms underlying Fagopyrum dibotrys-derived nanovesicles induced ferroptosis in hepatocellular carcinoma: a dual-pathway analysis of lipid peroxidation and mitochondrial damage

Affiliations

Molecular mechanisms underlying Fagopyrum dibotrys-derived nanovesicles induced ferroptosis in hepatocellular carcinoma: a dual-pathway analysis of lipid peroxidation and mitochondrial damage

Ling Wu et al. Front Pharmacol. .

Abstract

Background: Hepatocellular carcinoma (HCC) is a prevalent malignant tumor globally, with high incidence and mortality rates that seriously endanger human health. While traditional therapeutic approaches have demonstrated some efficacy in controlling disease progression, they are still fraught with numerous limitations. In recent years, plant-derived nanovesicles have garnered significant attention owing to their distinctive biological activities and promising antitumor characteristics. The effects of Fagopyrum dibotrys, a plant with various medicinal values, and its-derived nanovesicles (FdNVs) on HCC cells have not been clarified.

Objective: This study aimed to explore the inhibitory effects of FdNVs on human HCC cells and subcutaneous xenograft tumors, as well as the underlying molecular mechanisms.

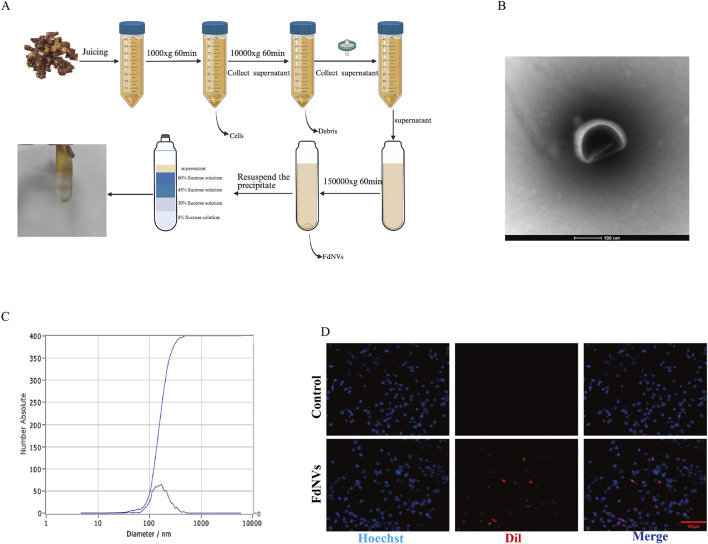
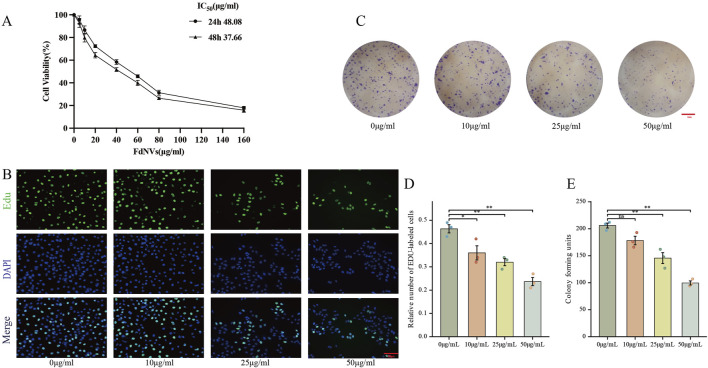
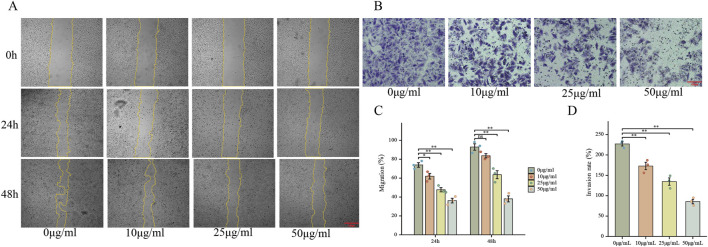
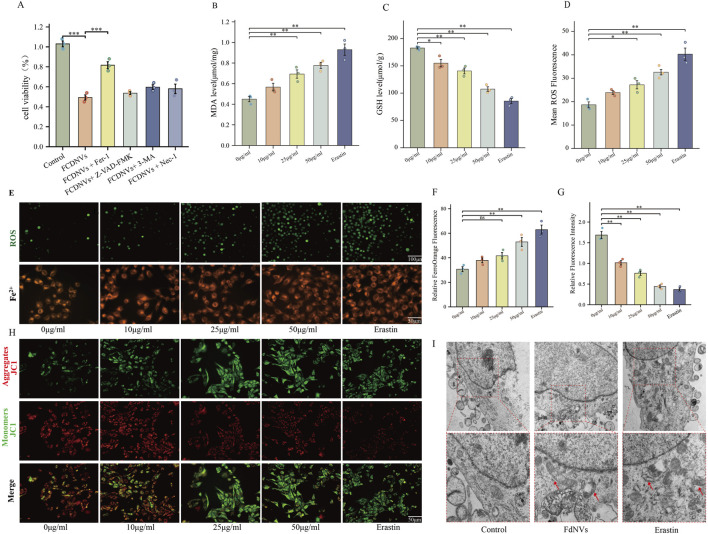
Methods: FdNVs were isolated and purified through ultracentrifugation, characterized via Nanoparticle Tracking Analysis (NTA) and Transmission Electron Microscopy (TEM), and subsequently evaluated in vitro using the HepG2 HCC cell line to assess their effects on proliferation (via cell viability, EdU, and colony formation assays), migration (wound healing assay), and invasion (Transwell assay), while mitochondrial ultrastructural changes were examined by TEM, intracellular ROS and Fe2+ levels were measured fluorometrically, oxidative stress markers (GSH and MDA) were quantified colorimetrically, ferroptosis-related mRNA and protein expression were analyzed by RT-qPCR and Western blot, followed by in vivo validation of their antitumor efficacy in a nude mouse HepG2 xenograft model.

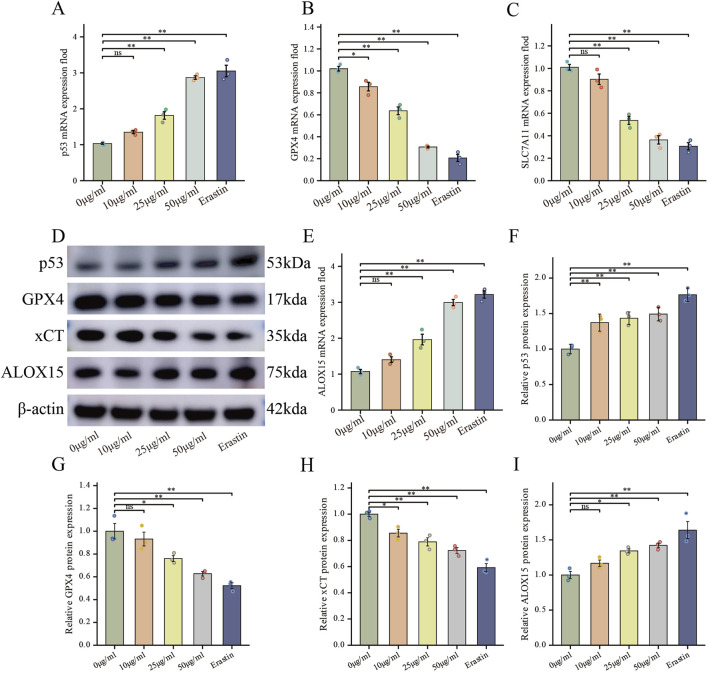
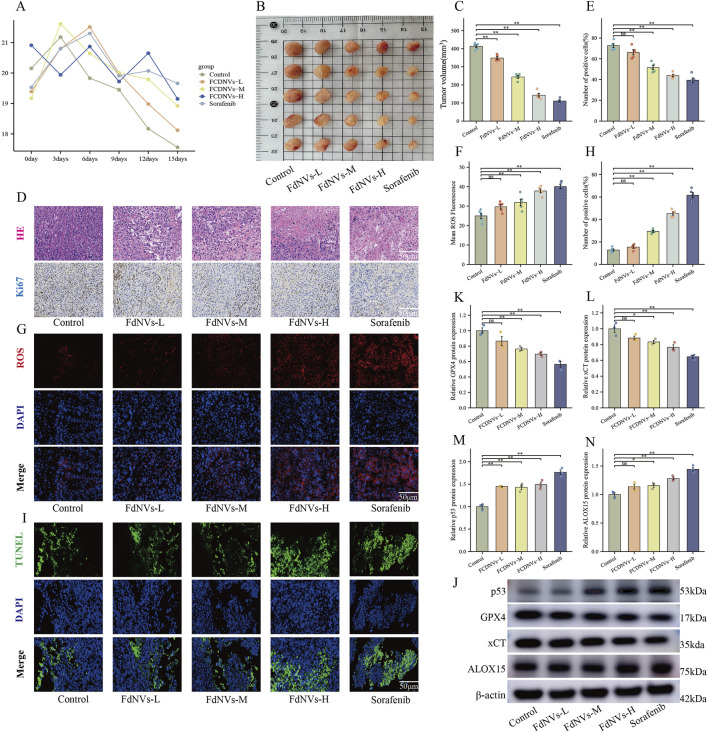
Results: In vitro studies demonstrated that FdNVs dose-dependently suppressed HepG2 cell proliferation, motility, and invasive capacity. Mechanistic investigations revealed that this inhibitory effect was mediated through ferroptosis activation, supported by the following observations: elevated intracellular ferrous iron (Fe2+) and reactive oxygen species (ROS), reduced glutathione (GSH) content, disrupted mitochondrial ultrastructure, and modulated expression of key ferroptosis regulators-including upregulation of pro-ferroptotic proteins (p53 and ALOX15) and downregulation of anti-ferroptotic factors (xCT and GPX4). Furthermore, in vivo studies validated the tumor-suppressive role of FdNVs, confirming their capacity to trigger ferroptosis in HepG2 xenografts.

Conclusion: FdNVs inhibited the proliferation, migration and invasion of HCC cells by inducing iron death, and their anti-tumor mechanism involved the regulation of iron death-related genes and proteins.

Keywords: Fagopyrum dibotrys; ferroptosis; hepatocellular carcinoma; in vitro and in vivo experiments; nanovesicles.


Conflict of interest statement

The authors declare that the research was conducted in the absence of any commercial or financial relationships that could be construed as a potential conflict of interest.

Figures

FIGURE 1
FIGURE 1
Characterization of FdNVs. (A) Schematic diagram of FdNVs extraction. (B) Morphology of FdNVs observed by TEM after ultracentrifugation. (C) Size distribution of FdNVs measured by NTA. (D) Uptake of FdNVs by HepG2 Cells.
FIGURE 2
FIGURE 2
Effects of FdNVs on HepG2 Cell Proliferation. (A) FdNVs reduced HepG2 cell viability. CCK-8 assay results showing cell viability after treatment with different concentrations of FdNVs for 24 or 48 h (B) EdU assay for cell proliferation. EdU-positive proliferating cells are shown in green, while DAPI-labeled live cells are shown in blue. (C) FdNVs inhibited HepG2 colony growth. (D) Quantification of relative EdU-positive cell numbers. (E) Statistical analysis of colony-forming units. Data are presented as mean ± SEM (n = 3). Statistical significance was assessed relative to the 0 μg/mL FdNVs group: *p < 0.05, **p < 0.01, ns (not significant, p > 0.05).
FIGURE 3
FIGURE 3
FdNVs Inhibit HepG2 Cell Migration and Invasion. (A) Wound healing assay showing the effect of FdNVs on HepG2 cell migration. Cells were incubated with 0, 10, 25, and 50 μg/mL FdNVs, and images were taken at 0, 24, and 48 h. Yellow lines outline the wound edges. (B) Transwell invasion assay (×100) assessing the invasive ability of HepG2 cells treated with FdNVs for 24 h. (C) Quantification of migration expressed as the percentage of the wound area covered by cells over time, with 0% corresponding to the initial wound area at 0 h. (D) Quantification of relative invasion rate of HepG2 cells across the membrane. Data are presented as mean ± SEM (n = 3). Statistical significance was assessed relative to the 0 μg/mL FdNVs group: *p < 0.05, **p < 0.01, ns (not significant, p > 0.05).
FIGURE 4
FIGURE 4
FdNVs Induce Ferroptosis in HepG2 Cells. (A) CCK-8 assay assessing cell viability under treatment with FdNVs (50 μg/mL) in the presence or absence of Fer-1, Z-VAD-FMK, 3-MA, and Nec-1. (B) MDA levels in HepG2 cells treated with different concentrations of FdNVs (0, 10, 25, 50 μg/mL) and Erastin (10 μM), measured using an MDA assay kit. (C) GSH levels in HepG2 cells treated with different concentrations of FdNVs (0, 10, 25, 50 μg/mL) and Erastin (10 μM), measured using a GSH assay kit. (D) Quantification of intracellular ROS levels in HepG2 cells treated with FdNVs, expressed as relative fluorescence intensity. (E) Detection of Fe2+ and ROS levels in HepG2 cells treated with FdNVs using FerroOrange and DCFH-DA fluorescence probes, respectively. (F) Quantification of FerroOrange fluorescence intensity, indicating intracellular Fe2+ levels. (G) Relative JC-1 aggregate/monomer fluorescence ratio, reflecting MMP. (H) JC-1 fluorescence staining showing MMP changes in HepG2 cells under different treatments. (I) TEM images of mitochondrial ultrastructure in HepG2 cells, highlighting ferroptosis-associated morphological changes, including mitochondrial shrinkage, cristae loss, and increased membrane density. Data are presented as mean ± SEM (n = 3). Statistical significance was assessed relative to the 0 μg/mL FdNVs group: *p < 0.05, **p < 0.01, ns (not significant, p > 0.05).
FIGURE 5
FIGURE 5
FdNVs Regulate the p53/xCT/GPX4 Signaling Axis to Induce Ferroptosis in HepG2 Cells. (A–C,E) RT-qPCR analysis of p53, GPX4, SLC7A11, and ALOX15 mRNA expression levels in HepG2 cells treated with different concentrations of FdNVs and Erastin. (D) Western blotting analysis of ferroptosis-related biomarkers p53, GPX4, xCT, and ALOX15 protein expression levels under different FdNVs and Erastin treatments. (F–I) Quantification of relative protein expression levels of p53, GPX4, xCT, and ALOX15, normalized to β-actin. Data are presented as mean ± SEM (n = 3). Statistical significance was assessed relative to the 0 μg/mL FdNVs group: *p < 0.05, **p < 0.01, ns (not significant, p > 0.05).
FIGURE 6
FIGURE 6
FdNVs Inhibit Tumor Growth and Promote Ferroptosis In Vivo. (A) Body weight monitoring of nude mice treated with different concentrations of FdNVs. (B) Representative tumor images from each treatment group. (C) Tumor volume analysis showing significant reduction in tumor size following FdNVs treatment in a dose-dependent manner. (D) Histopathological examination via HE staining and Ki67 immunohistochemical (IHC) staining to assess tumor proliferation. (E) Quantification of Ki67-positive cells, indicating a significant reduction in cell proliferation upon FdNVs treatment. (F) Quantification of ROS fluorescence intensity, demonstrating increased ROS levels in FdNVs-treated tumors. (G) ROS fluorescence staining showing elevated peroxide accumulation in tumor tissues. (H) Quantification of TUNEL-positive apoptotic cells, confirming enhanced apoptosis in the FdNVs-treated groups. (I) TUNEL staining images showing apoptotic cells in tumor tissues across different treatment groups. (J) Western blot analysis of ferroptosis-related markers GPX4, xCT, p53, and ALOX15 under different FdNVs and Sorafenib treatments. (K–N) Quantification of GPX4, xCT, p53, and ALOX15 protein expression levels, demonstrating ferroptosis activation in FdNVs-treated tumors. Data are presented as mean ± SEM (n = 5). Statistical significance was assessed relative to the Control group: *p < 0.05, **p < 0.01, ns (not significant, p > 0.05).

Similar articles

References

    1. Akce M., El-Rayes B. F., Bekaii-Saab T. S. (2022). Frontline therapy for advanced hepatocellular carcinoma: an update. Ther. Adv. Gastroenterol. 15, 17562848221086126. 10.1177/17562848221086126 - DOI - PMC - PubMed
    1. Bray F., Laversanne M., Sung H., Ferlay J., Siegel R. L., Soerjomataram I., et al. (2024). Global cancer statistics 2022: GLOBOCAN estimates of incidence and mortality worldwide for 36 cancers in 185 countries. Ca. Cancer J. Clin. 74, 229–263. 10.3322/caac.21834 - DOI - PubMed
    1. Chu K., Liu J., Zhang X., Wang M., Yu W., Chen Y., et al. (2024). Herbal medicine-derived exosome-like nanovesicles: a rising star in cancer therapy. Int. J. Nanomed. 19, 7585–7603. 10.2147/IJN.S477270 - DOI - PMC - PubMed
    1. Cui L., Perini G., Palmieri V., De Spirito M., Papi M. (2024). Plant-derived extracellular vesicles as a novel frontier in cancer therapeutics. Nanomater. (basel Switz.) 14, 1331. 10.3390/nano14161331 - DOI - PMC - PubMed
    1. Dad H. A., Gu T.-W., Zhu A.-Q., Huang L.-Q., Peng L.-H. (2021). Plant exosome-like nanovesicles: emerging therapeutics and drug delivery nanoplatforms. Mol. Ther. 29, 13–31. 10.1016/j.ymthe.2020.11.030 - DOI - PMC - PubMed

LinkOut - more resources