. 2025 Jun 26:16:1621657.
doi: 10.3389/fimmu.2025.1621657. eCollection 2025.

Amplification of select autonomous HERV loci and surrounding host gene transcription in monocytes from patients with post-acute sequelae of COVID-19

Affiliations

Amplification of select autonomous HERV loci and surrounding host gene transcription in monocytes from patients with post-acute sequelae of COVID-19

Hyunmin Koo et al. Front Immunol. .

Abstract

Background: The human genome contains approximately 3,200 near full-length autonomous human endogenous retroviral (HERV) genomes distributed across the 23 chromosomes. These autonomous HERV proviral genomes include long terminal repeats (LTRs) capable of promoting RNA transcription. In quiescent cells, most HERV loci remain transcriptionally silent. However, environmental changes, such as epigenetic remodeling of chromatin, can activate these silenced loci.

Methods: To study HERV reactivation, we previously analyzed autonomous HERV expression patterns in monocytes isolated from peripheral blood mononuclear cells (PBMCs) identified in single-cell RNA sequencing (scRNA-seq) databases using the Azimuth application. We developed a Window-based HERV Alignment (WHA) method, which analyzes aligned DNA sequences using sequential, non-overlapping windows of defined lengths. Samples were scored as positive (>= 9 good/usable windows) or negative (<= 8 good/usable windows).

Results: Using WHA, we established a control set from 31 normal individuals, with fewer than 8 windows at selected HERV loci. We analyzed scRNA-seq data from three studies of hospitalized COVID-19 patients and found distinct HERV expression patterns in monocytes. Unique patterns were also found in patients with influenza, Dengue virus, or sepsis. We next examined HERV expression at early (<7 days) and late (>14 days) timepoints post COVID-19 recovery and detected HERV loci in both groups. Analyzing 12 patients with post-acute sequelae of COVID-19 (PASC), we identified three HERV loci expressed in all patients. Some loci showed amplified numbers of good/usable windows, indicating longer transcripts and greater sequence depth. The most amplified locus was located within an intron of JAKMIP2, which, along with neighboring host genes, also showed increased transcription.

Conclusion: Previous studies have shown that viral infections, including COVID-19, influenza, and Dengue virus, as well as sepsis, can induce innate immune memory in monocytes through epigenetic remodeling of hematopoietic stem and myeloid precursor cells. The identification of co-amplified HERV loci and neighboring host gene transcripts in monocytes from PASC patients suggests expansion of epigenetically remodeled myeloid progenitors. The identification of these HERV-host gene patterns provides a foundation needed to understand the clinical features of patients with PASC.

Keywords: ScRNA-seq; epigenetic remodeling; human endogenous retrovirus (HERV); monocytes; post-acute COVID sequelae.


Conflict of interest statement

The authors declare that the research was conducted in the absence of any commercial or financial relationships that could be construed as a potential conflict of interest.

Figures

Figure 1
Figure 1
Distribution of positive HERV loci found in exposed, infected and three datasets of acutely infected COVID-19 patients. The positive HERV loci for the data sets for the exposed, infected and acutely infected patients is depicted in a vertical column. HERV loci that were accessed were depicted in a horizontal column. To identify the positive HERV loci in these datasets, we compared them with the pangenome control dataset consisting of 31 normal individuals, as previously described (30). Positive HERV loci in the PBMC datasets were identified through comparison with the normal pangenome control set. Red boxes indicate positive HERV loci, while yellow boxes indicate negative HERV loci below cut-off values for depth and windows count. Numbers of individuals per each group; 3 exposed COVID-19 individuals, 10 infected COVID-19 individuals, Acute 1: 11 patients; Acute 2: 10 patients; Acute 3: 12 patients. Note some samples contained multiple time points – see Supplementary Table 2 for detailed information on identity of each HERV locus.
Figure 2
Figure 2
Distribution of positive HERV loci found in patients infected with influenza, dengue virus or sepsis. The positive HERV loci found in PBMCs from patients infected with influenza, Dengue virus or sepsis is depicted in a vertical column. HERV loci that were accessed were depicted in a horizontal column. Red box indicates a positive HERV loci, yellow indicates a negative HERV loci below cut-off values for depth and windows. Numbers of patients per each group; Flu: 5, Dengue virus: 15, Sepsis: 4. Note some samples contained multiple time points – see Supplementary Table 3 for detailed information on identity of HERV loci.
Figure 3
Figure 3
Distribution of positive HERV loci found in individuals who were administered either the influenza or COVID-19 vaccines. The positive HERV loci found in PBMCs from patients who were administered either the influenza or COVID-19 vaccine is depicted in a vertical column. HERV loci that were accessed were depicted in a horizontal column. Red box indicates a positive HERV loci, yellow indicates a negative HERV loci below cut-off values for depth and windows. Number of individuals per each group; Flu vaccine: 1, COVID vaccine 6. Note some samples contained multiple time points – see Supplementary Table 4 for detailed information on identity of HERV loci.
Figure 4
Figure 4
Distribution of positive HERV loci found in individuals with early or late recovery, or those identified as PASC. The positive HERV loci found in PBMCs from patients post COVID-19 infection, categorized as early, late, or identified as PASC is depicted in a vertical column. HERV loci that were accessed were depicted in a horizontal column. Red box indicates a positive HERV loci, yellow indicates a negative HERV loci below cut-off values for depth and windows. Number of patients per each group; ERS: 5, LRS: 5, PASC 1 (8m): 12, PASC 2: 2. Note some samples contained multiple time points – see Supplementary Table 5 for detailed information on identity of HERV loci.
Figure 5
Figure 5
Distribution of positive windows found from analysis of samples from acute patients, early or late recovery patients and PASC patients. The number of the positive HERV loci for each locus were compiled and presented in a heatmap. The 8-month PASC patient sample set contained the greatest number of positive HERV loci. See Supplementary Table 7 for detailed information on identity of HERV loci.
Figure 6
Figure 6
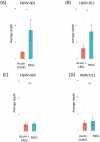
Comparison of the number of positive windows obtained from PASC patients and those found in the remaining datasets (acute, vaccinated, sepsis, influenza, Dengue virus, influenza virus and 24-month post-COVID). The number of positive windows for Individual HERV loci in the sample set from 8-month PASC patients was compared with the combined number of positives for the same loci from the remaining datasets. (A) Positive HERV loci identified at specific loci in the 8-month PASC samples with no positive HERV loci detected in any other datasets. The average number of good/usable windows, along with the standard deviation, observed in the PASC samples is shown in the figure. (B) Positive HERV loci identified at specific loci in the 8-month PASC samples compared to those detected at the same loci in the remaining datasets. The average number of good/usable windows for the top HERV loci in the PASC group was used to perform a t-test against the acute group. The number of positive windows for 1) HERV001 loci in PASC samples versus those found in the other samples 163-7 (Acute 3, Amrute et al.), TS4-A (Acute 2, Unterman et al.), 2) HERV015 loci in PASC samples versus those found in the other samples 80-0, 80-7, 154-0, 163-0, 163-7, 251-0, 251-7 (Acute 3, Amrute et al.), 3) HERV012 loci in PASC samples versus those found in the other samples S1-nCOV1, S12-nCOV6 (Acute 1, Lee et al.) and NS-1A, TP-6A, TP-7A, TP9-B, TS-4A, 4) HERV020 loci in PASC samples versus those found in the other samples 145-0, 163-0, 163-7,272-0, 272-7 (Acute 3, Amrute et al.). "**" = p-value < 0.05, "***" = p-value < 0.001.
Figure 7
Figure 7
Comparison of the sequence read depths of PASC patients at the same HERV loci in the remaining datasets. Comparison of the read depths for four HERV loci between the PASC dataset and the acute, vaccinated, sepsis, influenza and Dengue virus datasets using t-test ( Supplementary Table 7 ). Any statistically significant p-value (p < 0.05) are shown in the figure (‘ns’ indicates not significant). (A) The sequence read depth for HERV001 loci in PASC samples versus those found in the acute sample 163-7 (Acute 3, Amrute et al.) and TS4A (Acute 2, Unterman et al.). (B) The sequence read depth for HERV015 loci in PASC samples versus those found in samples 80-0, 80-7, 154-0, 163-0, 163-7, 251-0, 251-7 (Acute 3, Amrute et al.) and LRS1 (ERS/LRS, Wen et al.). (C) The sequence read depth for HERV020 loci in PASC samples versus 145-0, 163-0, 163-7,272-0, 272-7 (Acute 3, Amrute et al) and ERS5 (ERS/LRS, Wen et al.). (D) The sequence read depth for HERV012 loci in PASC samples versus samples S1-nCOV1, S12-nCOV6 (Acute 1, Lee et al.) and NS-1A, TP-6A, TP-7A, TP9-B, TS-4A (Acute 2, Unterman et al.). "**" = p-value < 0.001, "ns"= not significant.
Figure 8
Figure 8
Location of Host of HERV-001 and surrounding genes on Chromosome 5. (A) Chromosome 5 is shown with the subregion 5q32 indicated. A red box highlights the genomic region containing HERV-001 and its neighboring host genes. (B) An expanded view of this 772 kb region includes the host genes JAKMIP2, DPYSL3, SPINK1, STK32A, and SCGB3A2 (highlighted in red). HERV-001, located within intron 1–2 of JAKMIP2, is marked with a blue box and annotated as HERV-001 (intron of JAKMIP2). The bolded JAKMIP2-HERV001-SPINK1 reflects the localized amplification of the expression of these genes in the monocytes from the PASC.
Figure 9
Figure 9
Analysis of host gene expression in control, acute, early/late, PASC 24 month and 8 month PASC. For each host gene, the number of good/usable windows observed in each patient group was compared to the Control group using ANOVA followed by Tukey’s HSD test. Any statistically significant p-value (p < 0.05) are shown in the figure (‘ns’ indicates not significant). From this analysis, we identified 3 genes (DPYSL3, JAKMIP2, and SPINK1) with significantly higher numbers of good/usable windows in the PASC group.
Figure 10
Figure 10
Analysis of host gene expression in control, acute, early/late, PASC 24 month and 8-month PASC. For each host gene, the sequence depth observed in each patient group was compared to the Control group using ANOVA followed by Tukey’s HSD test. Any statistically significant p-value (p value < 0.05) are shown in the figure (‘ns’ indicates not significant). Two genes (SPINK1 and JAKMIP2) exhibited significantly higher read depth in the PASC group.

Similar articles

References

    1. Taks EJ, Moorlag SJ, Netea MG, Van-der-Meer JW. Shifting the immune memory paradigm: trained immunity in viral infections. Annu Rev Virol. (2022) 9:469–89. doi: 10.1146/annurev-virology-091919-072546 - DOI - PubMed
    1. Janeway CA, Jr., Medzhitov R. Introduction: the role of innate immunity in the adaptive immune response. Semin Immunol. (1998) 10:349–50. doi: 10.1006/smim.1998.0142 - DOI - PubMed
    1. Wolf AA, Yáñez A, Barman PK, Goodridge HS. The ontogeny of monocyte subsets. Front Immunol. (2019) 10:1642. doi: 10.3389/fimmu.2019.01642 - DOI - PMC - PubMed
    1. Greten TF, Manns MP, Korangy F. Myeloid derived suppressor cells in human diseases. Int Immunopharmacol. (2011) 11:802–7. doi: 10.1016/j.intimp.2011.01.003 - DOI - PMC - PubMed
    1. Agrati C, Sacchi A, Bordoni V, Cimini E, Notari S, Grassi G, et al. Expansion of myeloid-derived suppressor cells in patients with severe coronavirus disease (COVID-19). Cell Death Differentiation. (2020) 27:3196–207. doi: 10.1038/s41418-020-0572-6 - DOI - PMC - PubMed

LinkOut - more resources