. 2025 Jun 26:16:1594169.
doi: 10.3389/fneur.2025.1594169. eCollection 2025.

Multi-path direct current spinal stimulation extended survival in the SOD1-G93A model of amyotrophic lateral sclerosis

Affiliations

Multi-path direct current spinal stimulation extended survival in the SOD1-G93A model of amyotrophic lateral sclerosis

Zaghloul Ahmed et al. Front Neurol. .

Abstract

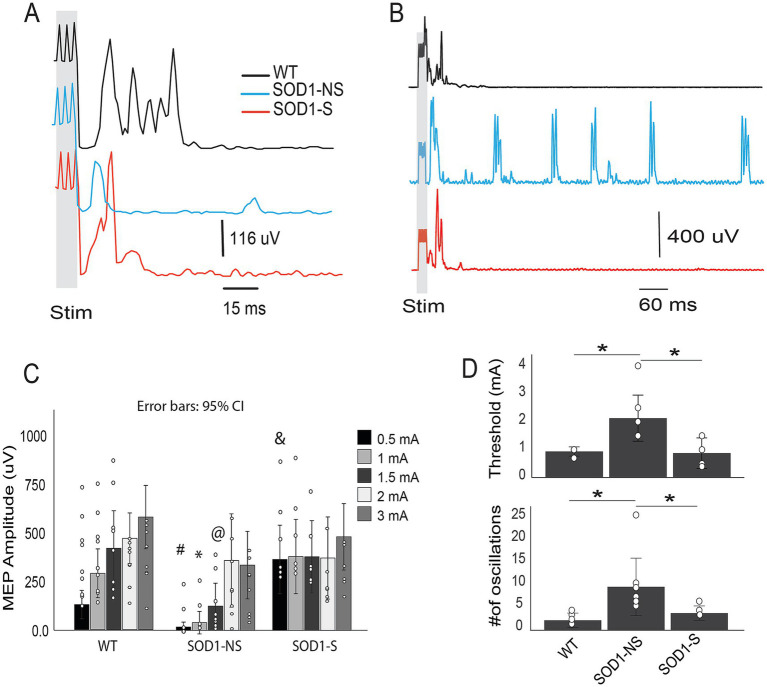
Introduction: Amyotrophic lateral sclerosis (ALS) is a progressive neurodegenerative disease that affects motor neurons in the spinal cord and brain. We have developed a novel non-invasive approach, MultiPath-DCS, which utilizes direct current stimulation at multiple sites along the neural axis to provide simultaneous spinal and peripheral stimulation targeted at the affected limbs. MultiPath-DCS modulates the excitability of spinal cord neurons. This effect is significant for ALS, as motor neuron hyperexcitability is a fundamental characteristic of the disease.

Methods: This study used a transgenic mouse model of ALS (SOD1-G93A). Anodal-MultiPath-DCS was applied with six electrodes: three on the spine (centered on T13 and with an anodal polarity), two on the sciatic nerves (one on each nerve), and one on the abdomen. Mice were divided into two groups (stimulated vs. unstimulated or sham-stimulated). The stimulated animals received stimulation for one hour a day, three times a week, for three weeks. Survival was calculated from the onset of the disease and birth until the animal's endpoint. We also performed various electrophysiological and molecular experiments to uncover the mechanism of action.

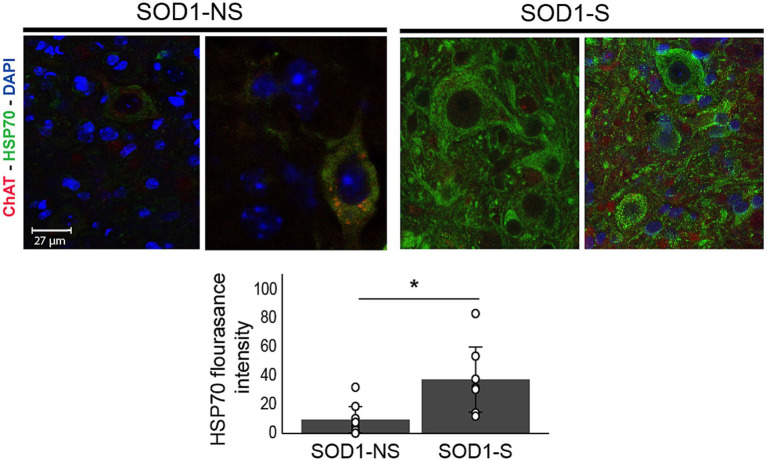
Results: We demonstrated molecular changes induced by anodal MultiPath-DCS, including (a) reduced expression of mutant SOD1 protein, (b) decreased expression of elevated NKCC1, (c) reduced phosphorylated tau, (d) increased expression of HSP70, and (e) increased expression of LC3B. Additionally, we found that treatment with Anodal-MultiPath-DCS (anode on the spinal column) reduces long-term neuronal spinal excitability, slows the progression of muscle weakness, and extends the lifespan of stimulated mice. The mean survival time in the control group was 12.4 days. In comparison, the mean survival time in the stimulated group was 21.6 days using a therapeutic stimulation paradigm, representing a 74% increase in survival from disease onset. Spinal motor neuron survival showed a 54% increase in stimulated compared to non-stimulated groups.

Discussion: Combined, this data provides evidence that Anodal-MultiPath-DCS reduces hyperexcitability and enhances the clearance of misfolded proteins by modulating autophagy and proteolytic systems. By decreasing spinal excitability and clearing toxic proteins from motor neurons, Anodal-MultiPath-DCS promotes survival and could serve as a disease-modifying intervention for ALS.

Keywords: ALS (amyotrophic lateral sclerosis); direct current stimulation (tDCS); neuroprotection; spinal motor neuron; survival.


Conflict of interest statement

ZA holds patents for multi-site neuromodulation and is the scientific founder of PathMaker Neurosystems Inc., a company developing non-invasive devices for treating ALS and stroke based on neuronal hyperexcitability suppression technology directly related to the present work. The remaining authors declare that the research was conducted in the absence of any commercial or financial relationships that could be construed as a potential conflict of interest.

Figures

Figure 1
Figure 1
Stimulation circuit, device, mouse setup, and stimulation paradigm. (A) Equivalent circuit; R1, R2, and R3 are spinal electrodes (electrode-skin interface resistance); R4 and R6 are sciatic electrodes; R5 is the abdominal electrode; R7 and R8 are variable resistances that adjust the current passing through R4, R5, and R6. (B) The MultiPath DCS device was designed and manufactured by PathMaker Neurosystems Inc., incorporating the circuit shown. (C) Spinal and sciatic electrodes are assembled, displaying the three spinal and two sciatic electrodes (top). (D) Drawings on a SOD-1 mouse depict the location and sizes of electrodes. T13 is the thirteenth vertebra used as an electrode placement marker. (E–G) Stages of motor dysfunction in SOD-1 model mice. Serial images were taken from a video recording of the SOD-1 mouse. (E) Ground walking is in the early stage; the knee is not flexed during stepping, and there is an abnormal pattern in lift-off and single stance (but successful). Right: an image from a mouse in a pre-symptomatic stage contrasts with the stages of the disease. Left. (F) Ground walking during the middle stage. In this stage, push-off is partially successful, but lift-off fails and occasional dorsal stepping occurs. The arrow in E also indicates the mouse using the knees as a brace. (G) Late-stage images show slight HL movement (1–3). Note that the right leg is extended with no movement. (H) The timeline of the survival experiment shows onset, stimulation frequency (1 h per day, three times a week), and conclusion.
Figure 2
Figure 2
A-MultiPath-DCS increased the survival time and slowed down motor dysfunction in SOD1 mice. (A,B) Survival time was calculated from the day of disease onset. K-M analysis shows that therapeutic stimulation with A-MultiPath-DCS significantly increased the survival time of the transgenic mice. The stimulated group (n = 23) had a significantly longer survival time compared to the unstimulated group (n = 25), as tested by Breslow (generalized Wilcoxon): Chi-Square = 12.25, p = 0.0005. We also conducted a comparison between the unstimulated and stimulated groups using an independent t-test, which showed a significant difference (p = 0.023). (C,D) The survival time was calculated from the date of birth of the animals. K-M analysis showed a significant difference in the survival time, as tested by Breslow (generalized Wilcoxon) (p = 0.018), (C) we also conducted a comparison between the unstimulated and stimulated groups using an independent t-test, revealing a significant difference (p = 0.031). (D) Overall, the data demonstrate that therapeutic A-MultiPath-DCS stimulation prolonged animal survival time when survival is calculated either from disease onset or from birth to death. (E) A line diagram shows average changes in motor function in a subgroup of animals (tested by the walking grid test). The shaded area represents scores before the onset of the disease. SOD1-NS, non-stimulated SOD1 carrier mice; SOD1-S, stimulated SOD1 carrier mice; WT, wild-type mice.
Figure 3
Figure 3
The effects of A-MultiPath-DCS on TA-EMG activity and EMG stretch reflex were measured in the early stage of the disease. The stretch apparatus was used to stretch muscles and concurrently record EMG from the triceps surae muscles. TA-EMG activity was recorded during periods before applying the stretch protocol. (A) TA-EMG activity was recorded before and during A-MultiPath-DCS in wild-type (top) and SOD1 (bottom) mice. Note the immediate reduction of TA-EMG activity upon turning on stimulation (A-MPS). (B) Firing rate (spikes/s) was calculated and compared before and after A-MultiPath-DCS (n = 9; p = 0.02). (C) Examples of stretch reflexes showing muscle resistance (MR), RMS-EMG, and raw EMG recorded before and after stimulation. (D) EMG amplitude and area were significantly reduced after A-MultiPath-DCS (n = 9, p = 0.02; and p = 0.023, respectively, paired t-test).
Figure 4
Figure 4
Characterizing TA-EMG activity and its interaction with the stretch reflex responses in later stages of the disease and effects of A-MultiPath-DCS. (A) Example of EMG activity recorded from the same animal before onset and 32 days later when the animal was in a late-stage condition. Note that pre-symptomatic TA-EMG was almost absent; however, in the later stage of the disease, TA-EMG was continuous and had a higher amplitude. (B) Example of the late-stage stretch reflex and vibration-induced response. Initiating stretch reflex with a stretch device or using a vibration pulse did not induce a reflexive response and caused depression of TA-EMG. (C) A-MultiPath-DCS reduced TA-EMG (as shown in Figure 3), which caused the reappearance of the reflexive responses to stretch and vibration. Blue: muscle resistance; green: RMS-EMG; Red: raw EMG. (D) Bar graph showing average data from the same group of animals (n = 9) at different stages of disease progression and following treatment with A-MultiPath-DCS. At the onset of the disease, animals manifest exaggerated reflex responses significantly higher than pre-symptomatic reflexes (p = 0.011, t-test). These exaggerated responses were significantly depressed and mostly not inducible at the late stage of the disease (p = 0.027). 60 min of treatment with A-MultiPath-DCS reduces TA-EMG activity and allows stretch reflexes to be expressed, which increased significantly compared to before stimulation (p = 0.006).
Figure 5
Figure 5
The immediate effects of A-MultiPath-DCS on tremor in the hindlimbs. A microgoniometer recorded tremors to measure the oscillations of the paw. At a range of current intensities (0.5 to 1.5 mA), tremors mostly disappeared. Higher intensities (>1.5 mA) cause the reappearance of tremors and intensify them. Therefore, in 5 animals, we used a current intensity of 1.5 mA to suppress tremors. (A) Example of tremor trace and concurrent EMG recorded before and during A-MultiPath-DCS. Note the complete reduction of tremors and the concurrent EMG. (B) The period of tremors was significantly increased during and after A-MultiPath-DCS (F (2,12) = 7.651, p = 0.014, Repeated Measure ANOVA). During stimulation, the period was increased from 0.77 to 6.4 s (p = 0.039), and remained high after stimulation ceased (2.7 s, p = 0.021). (C) The amplitude of tremors was reduced significantly, as shown in panel (C) (F(2,12) = 7.69, p = 0.014, Repeated measure ANOVA). During stimulation, the tremor amplitude is reduced from 31.4 to 17 uV, (p = 0.026). Following the end of stimulation, the amplitude is significantly lower (21.8 uV) compared to before stimulation (p = 0.008). This effect was maintained for at least 24 h following 60 min of A-MultiPath-DCS (data not shown). * indicates significance compared to before treatment.
Figure 6
Figure 6
Characterizing motor evoked potential (MEP) in SOD- 1 mice after A- MultiPath- DCS treatment. SOD- 1 mice underwent A- MultiPath- DCS treatment five times over a ten- day period, after which they were anesthetized and tested for motor- evoked potential (wild- type: n = 9; SOD 1 non- stimulated: n = 8; SOD 1 stimulated: n = 6). MEP was elicited by stimulating the hindlimb motor cortical area and recorded from the triceps surae muscles of the contralateral side (to the cortical area). (A) Examples of MEPs demonstrating differences in the first responses evoked at 1 mA. (B) Examples of MEP showing oscillations following the first responses at a 2 mA cortical stimulus intensity. In this case, oscillations were observed only in the non- stimulated carrier group and persisted for at least 1 min after the cortical stimulus. (C) Bar graph showing average MEPs at increasing cortical intensities (0.5 to 3 mA). The MEP amplitude at the lower cortical stimulus intensity of 0. 0.5 mA showed that the SOD 1- nonstimulated (SOD 1- NS) group had significantly lower responses compared to the SOD 1- stimulated (SOD 1- S) group (p = 0.000016), but not compared to WT (p = 0.119). At the same intensity, the SOD 1- S group also had significantly higher amplitude compared to WT (p = 0.001). At 1 mA, SOD 1- NS exhibited significantly lower amplitude than both WT (p = 0.006) and SOD- S (p = 0.00086). At 1. 1.5 mA, SOD 1- NS recorded significantly lower responses than WT (p = 0. 02), but not significantly different from SOD- S (p = 0.089). No significant differences were found among the groups at the other intensities tested (2 and 3 mA). (D) Top: bar graphs showing the average threshold in mA, and the bottom graph shows the number of oscillations from the 1- pulse stimulation. Comparisons between the groups using ANOVA indicate statistical significance (F (2, 14) = 7.67, and p = 0.006). The SOD 1- NS group displayed a higher threshold (2.14 ± 0.89 mA, n = 7) compared to wild- type (0.94 ± 0.13 mA, p = 0.016, n = 5) and SOD 1- S (0.88 ± 0.44, p = 0.012, n = 5), Tukey HSD. Bottom: For the number of post- stimulus oscillations, One- way ANOVA revealed a significant difference among the groups (F (2, 12) = 4. 41, p = 0.033). The number of post- stimulus oscillations was significantly higher in the SOD 1- NS group for 6- pulse (9.71 ± 6.9) cortical stimulation compared to wild- type (1.5 ± 0.5 and 2.2 ± 1.2, respectively, p = 0.039), but not compared to the SOD 1- S group (1.6 ± 0.7 and 3.8 ± 1.3, respectively, p = 0.113, Tukey test HSD). # denotes significance between SOD 1- S and SOD 1- NS; & denotes SOD 1- S compared to WT; * denotes SOD 1- NS compared to both SOD 1- S and WT; @ denotes SOD 1- NS significance compared to WT but not SOD 1- S.
Figure 7
Figure 7
A-MultiPath-DCS upregulates HSP70 expression. HSP70 expression was significantly increased in the spinal cords of stimulated SOD1 mice. The HSP70 immunofluorescence intensity of single spinal motor neurons was calculated using ImageJ. The bar graph represents the average HSP70 intensity in SOD1-Stimulated (SOD1-S) (n = 7) and SOD1-nonstimulated (SOD1-NS) (n = 8). Images from control wild-type animals are included for reference. *p = 0.012.
Figure 8
Figure 8
A-MultiPath-DCS reduces NKCC1 expression in spinal motor neurons. Top images: examples of spinal slices from four groups stained for NKCC1 (green). Bottom: bar graph showing average NKCC1 intensities in wild-type non-stimulated (n = 2) versus wild-type stimulated (n = 2); and SOD-1 non-stimulated (n = 6) versus SOD1 stimulated mice (n = 5). *p = 0.00009.
Figure 9
Figure 9
Surviving spinal motor neurons were significantly higher in A-MultiPath-DCS SOD1-stimulated (SOD1-S) animals. Three groups of mice were used to investigate spinal motor neuron survival: Wild-type (n = 4), SOD1 non-stimulated (NS, n = 6), and SOD1 stimulated (S, n = 5). SOD1 mice began real or sham intervention at the onset of the disease. All animals were sacrificed 10 days later. The upper lumbar spinal cord region was sliced (3 slices per mouse) and immunostained for ChAT to mark and count motor neurons. Neurons were counted using the counting functions in Photoshop software. (A) Examples of ChAT-stained ventral horns from wild-type animals. This graph shows the entire slice on the left, and the boxed area indicates the region used for counting the ChAT-stained neurons. Cholinergic neurons in the central canal region or dorsal horn were not included in the count. A magnification of the boxed area is displayed on the right side of the graph, which also reveals two main clusters of motor neurons. (B) The clusters are shown on the left (1 and 2) and the right (3 and 4) sides of the spinal cord slice for both SOD-NS and SOD1-S. The arrowhead points to a relatively larger neuron that survived in the SOD1-S. (C) Bar graph showing the comparison between the three groups. WT has a significantly higher number of spinal motor neurons than the SOD1-NS group (**p = 0.0001) and the SOD1-S group (**p = 0.011); the SOD1-S group has a significantly higher number of neurons than the SOD1-NS group (*p = 0.01).
Figure 10
Figure 10
A-MultiPath-DCS reduces the expression of hSOD1. (A–E) Photomicrographs of spinal cords in stimulated and non-stimulated mice. (F) Bar graph showing significantly lower hSOD-1 intensity in stimulated animals (SOD1-NS: 8 slices from 4 animals; SOD1-S: 5 slices from 5 animals). (C,D) Zoom-in confocal images of ventral horns of spinal cords from WT, SOD1-NS, and SOD1-S mice. (F,G) Images of single motor neurons showing the level and location of hSOD1 expression. Note that in SOD1-NS, hSOD1 spreads everywhere [cytoplasm and nucleus (arrows)], and that was reduced in SOD1-S. This result was confirmed using z-stack imaging. (H) Summary bar graph showing the means of the total intensity of hSOD1 protein in SOD1-NS and SOD1-S mice.
Figure 11
Figure 11
Summary diagram of the proposed mechanism of action. The diagram summarizes the published data on the effects of direct current on cellular mechanisms such as AMPA and NMDA receptors, voltage-gated calcium channels (VGCC), and the sodium-potassium pump, along with their potential downstream cellular effects. The check mark indicates that the results are based on published or unpublished data. The question mark signifies a hypothetical pathway that has not yet been experimentally tested. The conclusion is that anodal direct current stimulation activates a universal protein clearance mechanism applicable to many misfolded proteins. Black dot: calcium molecule; Orange triangle: Glutamate; a-DCS: anodal DCS; VGCC: voltage-gated calcium channel; HSF1: heat shock factor −1. See text for further explanation.

Similar articles

References

    1. Suzuki N, Nishiyama A, Warita H, Aoki M. Genetics of amyotrophic lateral sclerosis: seeking therapeutic targets in the era of gene therapy. J Hum Genet. (2023) 68:131–52. doi: 10.1038/s10038-022-01055-8, PMID: - DOI - PMC - PubMed
    1. Foran E, Trotti D. Glutamate transporters and the excitotoxic path to motor neuron degeneration in amyotrophic lateral sclerosis. Antioxid Redox Signal. (2009) 11:1587–602. doi: 10.1089/ars.2009.2444, PMID: - DOI - PMC - PubMed
    1. Salim B, Ahmed Z. Modulation of the sodium/potassium ATPase function and expression by transcranial direct current stimulation of the right sensorimotor cortex in Mice [PhD Thesis]. Academic Works. (2017). Available at: https://academicworks.cuny.edu/gc_etds/2158
    1. Di Lazzaro V, Ranieri F, Capone F, Pilato F, Profice P, Pellegrino G, et al. Motor cortex stimulation for ALS: open label extension study of a previous small trial. Brain Stimul. (2014) 7:143–4. doi: 10.1016/j.brs.2013.08.008, PMID: - DOI - PubMed
    1. Di Lazzaro V, Pilato F, Profice P, Ranieri F, Musumeci G, Florio L, et al. Motor cortex stimulation for ALS: a double blind placebo-controlled study. Neurosci Lett. (2009) 464:18–21. doi: 10.1016/j.neulet.2009.08.020, PMID: - DOI - PubMed

LinkOut - more resources